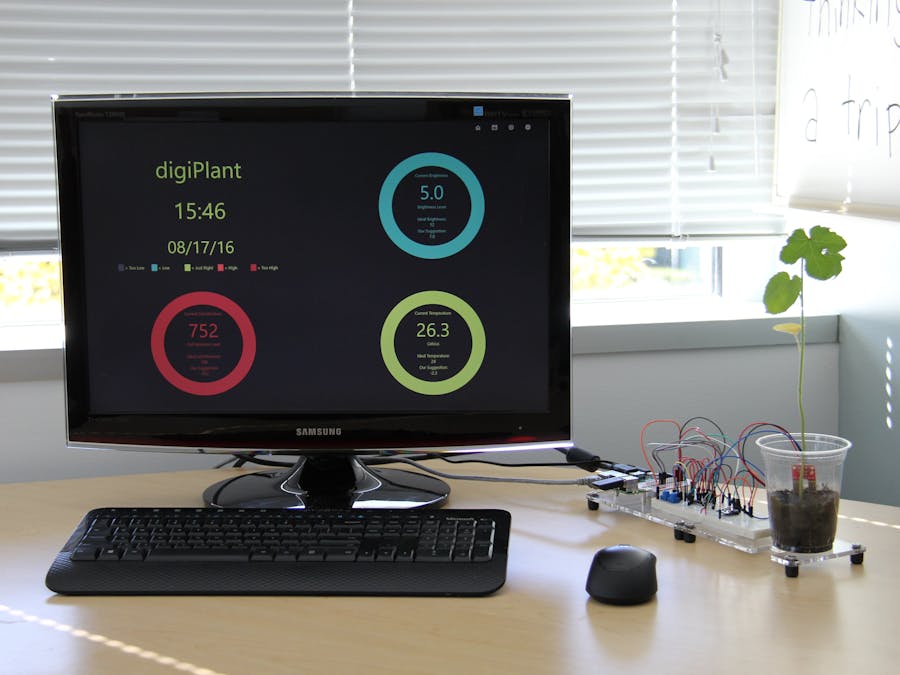
digiPlant is a Universal Windows Platform app that helps users monitor their plant. The app collects, tweets, and displays temperature, brightness, and soil moisture data from various sensors. It runs on a Raspberry Pi and Windows 10 IoT Core.
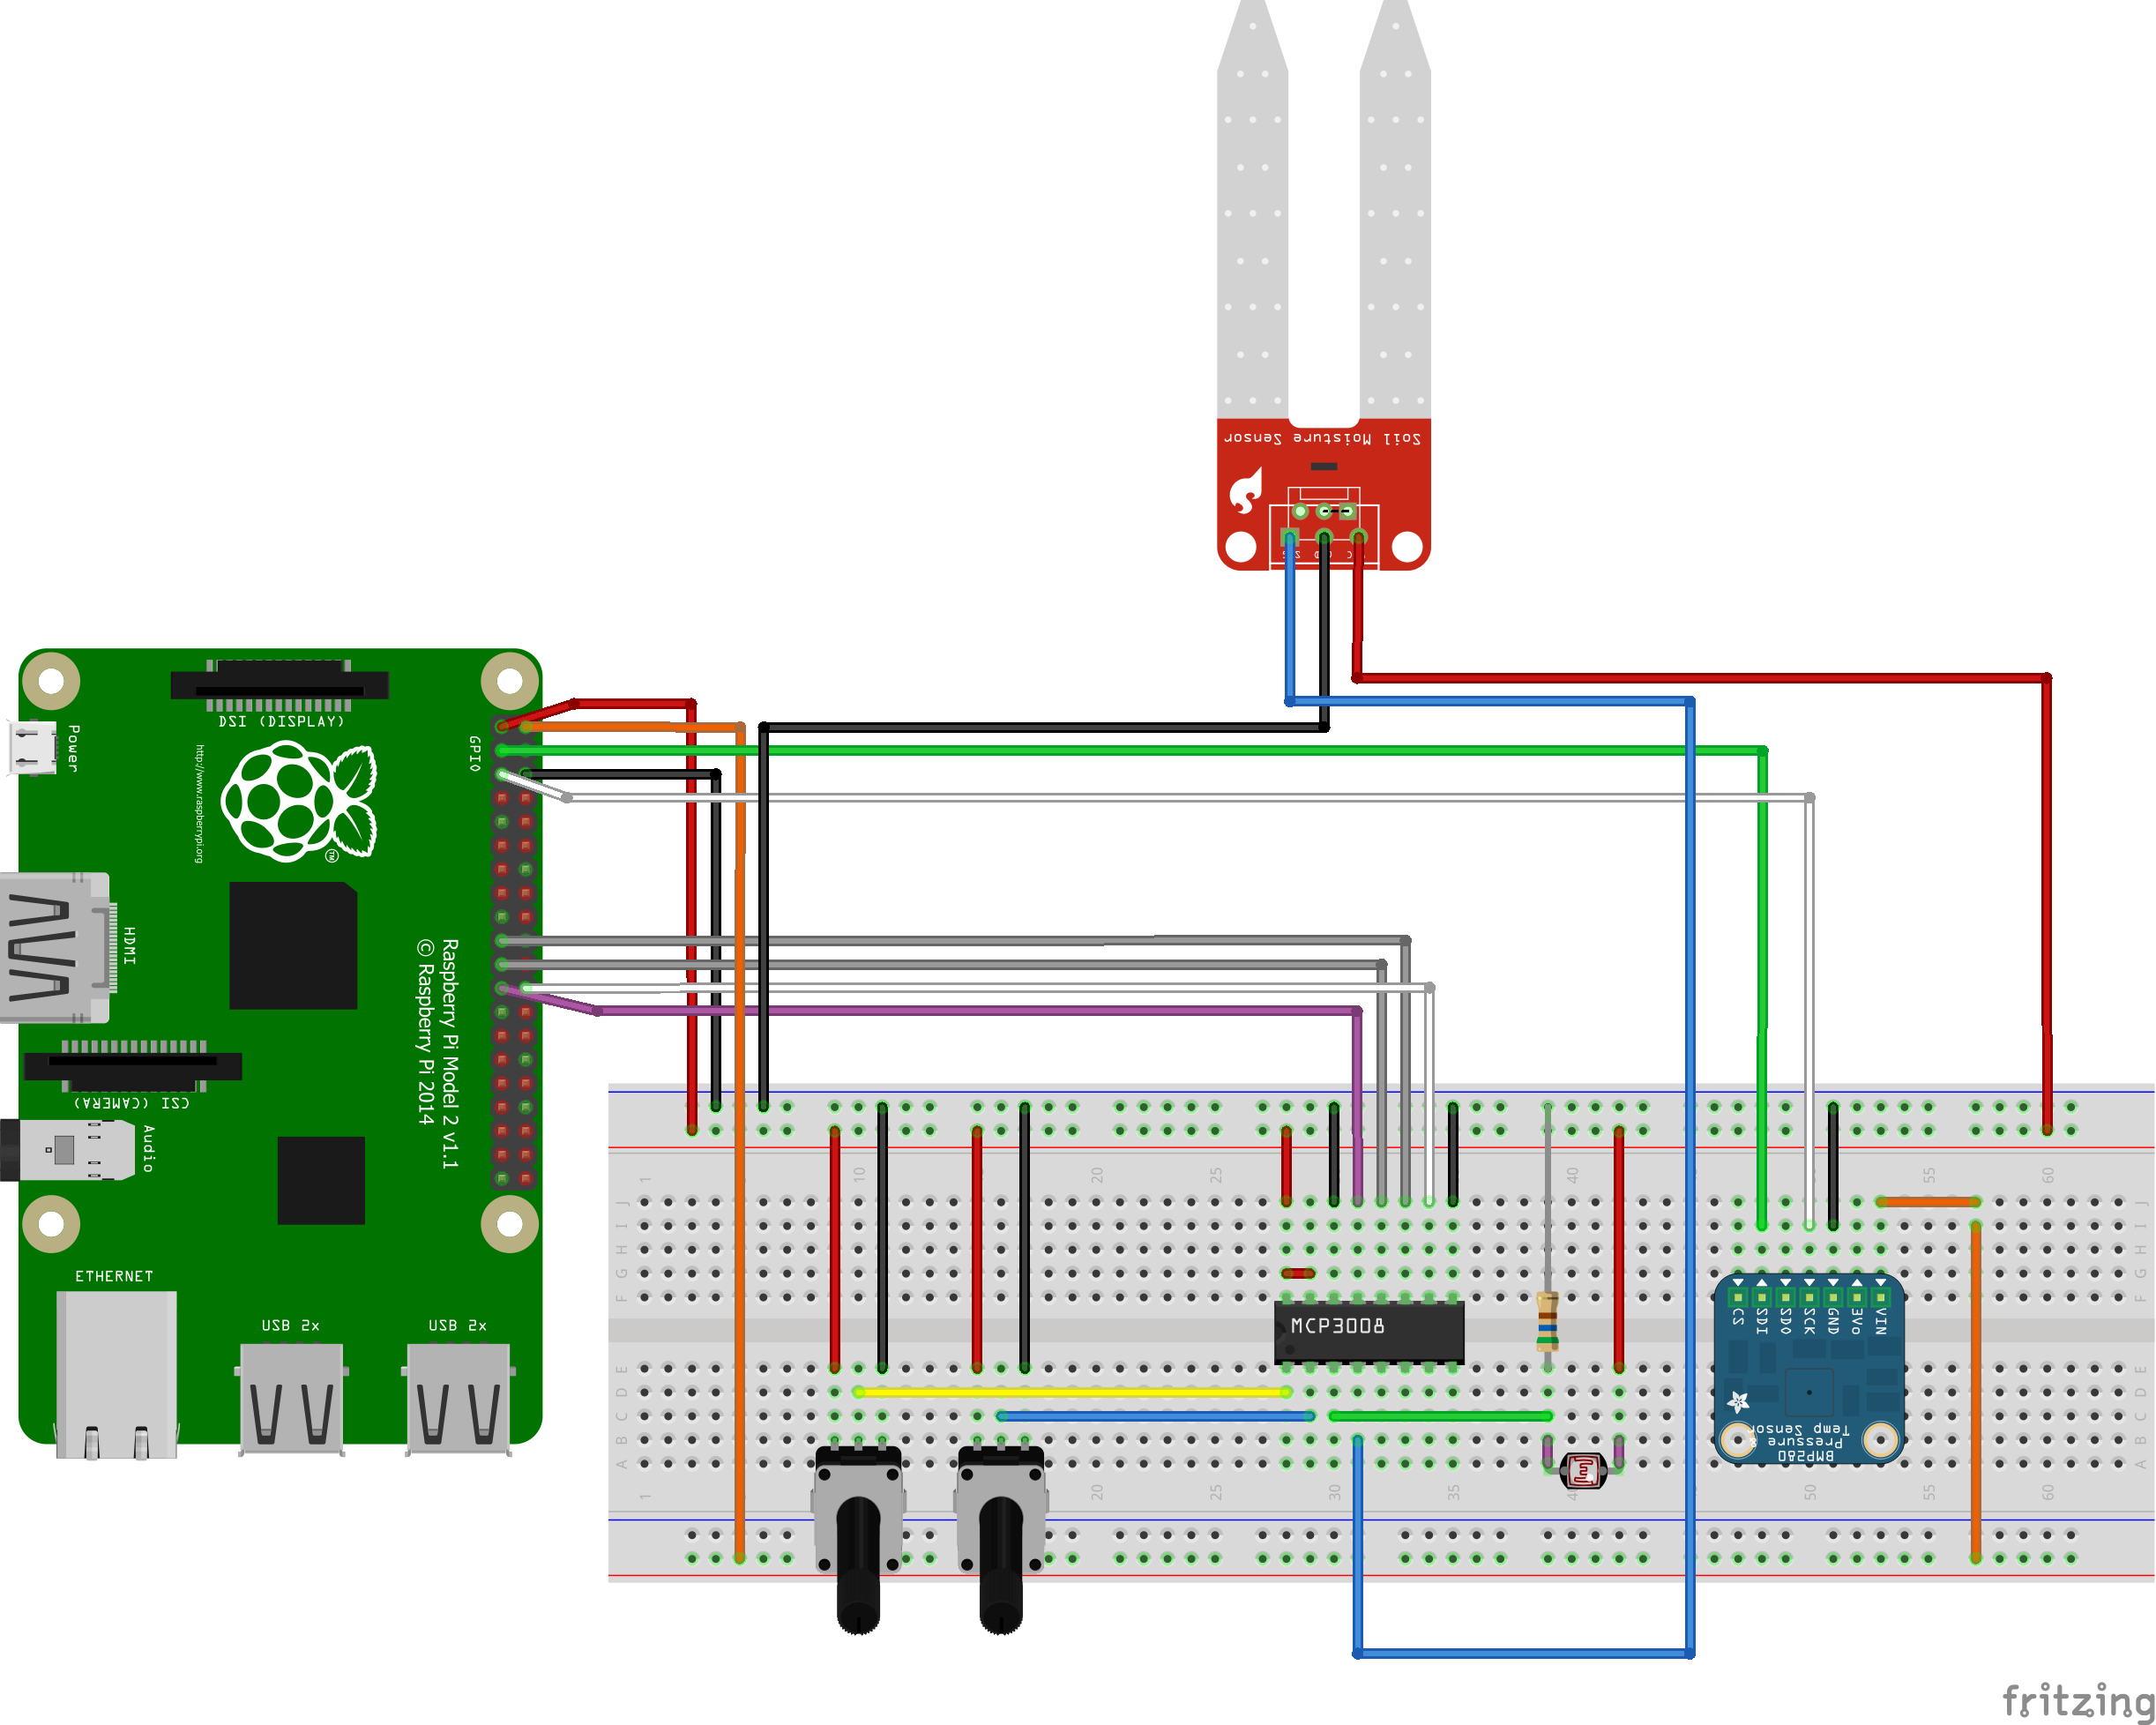
Hardware SetupThe fritzing diagram and the list of materials show how the hardware can be built. The photocell and the soil moisture sensor will need the ADC in order for it to measure data and give meaningful results. The soil moisture sensor will also need soldering.
This page displays live data that are collected by the various sensors within ellipses. The colors give a sense of how close the current data is to ideal values (which can be altered by the user).
TwitterPage.xaml.csThis class allows users to be able to have their plant tweet status. The UI describes how to set up a Twitter account, and the fields required to connect to a Twitter page is displayed. There is also a running history of the tweets that the plant has made.
SensorDataProvider.csThis class creates all of the sensor objects. Then using a timer, the app receives the measurement from the sensors every three seconds, and sends the sensor, time of measurement, and value of measurement to the main page where it will be displayed.
/**
* This method records on a timer the data
* measured by the temperature, brightness, and soil moisture sensor,
* then organizes all of the information collected.
* */
private async void timerCallback(object state)
{
  //ensures that the temperature sensor is initialized before it is measured from
  if (BMP280 == null)
  {
	Debug.WriteLine("BMP280 is null");
  }
  else
  {
      //receives the value from the temperature sensor and saves
	//the data in the SensorDataEventArgs class, which holds
	//the sensor name, the data point, and the time the value was measured.
	//this data is then sent back to the main page and the UI is adjusted based
	//off of the measurement.
	//float currentTemperature = (float) rand.NextDouble() * 10;
	float currentTemperature = await BMP280.ReadTemperature();
	var tempArgs = new SensorDataEventArgs()
	{
	    SensorName = "Temperature",
	    SensorValue = currentTemperature,
	    Timestamp = DateTime.Now
	};
	OnDataReceived(tempArgs);
   }
   //MCP3008 is an ADC and checks to see if this is initialized.
   //the soil moisture sensor and the photocell are on
   //different channels of the ADC
   if (mcp3008 == null)
   {
       Debug.WriteLine("mcp3008 is null");
   }
   else
   {
	//The first line reads a value from the ADC
	//from the photo cell sensor usually between 0 and 1023.
	//then the second line maps this number to a voltage
	//that represents this number
	int cdsReadVal = mcp3008.ReadADC(CDSADCChannel);
	float cdsVoltage = mcp3008.ADCToVoltage(cdsReadVal);
	//float currentBrightness = (float)rand.NextDouble() * 10;
	float currentBrightness = cdsVoltage;
	var brightnessArgs = new SensorDataEventArgs()
	{
	    SensorName = "Brightness",
	    SensorValue = currentBrightness,
	    Timestamp = DateTime.Now
	};
	OnDataReceived(brightnessArgs);
	//float currentSoilMoisture = (float)rand.NextDouble() * 10;
	float currentSoilMoisture = mcp3008.ReadADC(SoilMoistureChannel);
	Debug.WriteLine(currentSoilMoisture);
	var soilmoistureArgs = new SensorDataEventArgs()
	{
	    SensorName = "SoilMoisture",
	    SensorValue = currentSoilMoisture,
	    Timestamp = DateTime.Now
	};
	OnDataReceived(soilmoistureArgs);
   }
}
This page shows historical data that the sensors have measured. The historical data is stored chronologically in three different files for each sensor. The user can select within what time frame the history data is shown. These time frames are one day, one week, two weeks, four weeks, and eight weeks. In the one day view, it averages the data out per hour. For one week, two weeks and four weeks, the averages are based off of days. And eight weeks is based off of weeks.
Then it displays the data points stored between the last time the sensors measured and twenty four hours prior to that.
The temperature, brightness, and soil moisture graphs are presented in the history page within a scroll view.
Within the method of this code snippet, all of the measurements for the various sensors are organized inside of a dictionary. The data within each hour are averaged, then are stored together representing that hour. Each of these averages and their corresponding hour will become a data point on the 1 day view of the charts. This dictionary will be used in the day view where the data points will be averaged into days.
/**
* sets up the list by hour
* returns hourDictionary: the hour dictionary will be
* used in the day sorting method
* */
public Dictionary<DateTime, List<float>> setUpGeneralMasterListPerHour
			(IList<string> fileList, List<ChartDataPoint> masterList)
{
  //creates a dictionary where all of the information is stored.
  Dictionary<DateTime, List<float>>  hourDictionary =
				new Dictionary<DateTime, List<float>>();
  DateTime upperBound = DateTime.Now;
  TimeSpan fiftySixDays = new TimeSpan(56,0, 0, 0);
  TimeSpan twentyFourHours = new TimeSpan(24, 0, 0);
  //the earliest date that the chart will show is in the lowerBound variable
  DateTime lowerBound = upperBound - fiftySixDays;
  DateTime currentDate;
  DateTime comparedDate = DateTime.Now;
  DateTime oldDate;
  //goes through every data point that the sensors have collected
  for(int ii = 0; ii < fileList.Count; ii++)
  {
	String nextString = fileList[ii];
	String[] subStrings = nextString.Split(delimiter);
	//nextFloat holds the sensor data
	float nextFloat = float.Parse(subStrings[0]);
	//currentDate holds the time that the nextFloat value was measured
	currentDate = DateTime.Parse(subStrings[1]);
	if (currentDate > lowerBound && currentDate <= upperBound)
	{
	    //the minute and the second data is not valuable in the hour view
	    comparedDate = new DateTime(currentDate.Year,
	    currentDate.Month, currentDate.Day, currentDate.Hour, 0, 0);
	    if (hourDictionary.ContainsKey(comparedDate))
	    {
              hourDictionary[comparedDate].Add(nextFloat);
   		//changes the date
   		oldDate = comparedDate;
	    }
	    else
	    {
   	        List<float> newList = new List<float>();
   		newList.Add(nextFloat);
   		hourDictionary.Add(comparedDate, newList);
	    }
	}
  }
  foreach(DateTime hour in hourDictionary.Keys)
  {
      //we only need the last twenty four hours
	lowerBound = comparedDate - twentyFourHours;
	if (hour > lowerBound && hour <= comparedDate)
	{
	    masterList.Add(new ChartDataPoint() { Name = hour.ToString("HH:00"),
				Amount = hourDictionary[hour].Average() });
	}
  }
  return hourDictionary;
}
This is where the user can change the settings for their app. Once it is saved, they can see the changes in the Main Page.
The name of the plant and the plant twitter account fields will be used in V 2.0 of this app, when the twitter functionality is completed. An example tweet would be, "Joseph needs watering!" using the @TweetingJoseph handle.
The ideal plant temperature, brightness, and soil moisture fields are for the user to determine twhat they want these values to be at what time. When these are changed it allows the user to compare the live data to the ideal values and change the environment accordingly.
App BarAt the top right of each page, their is an app bar to help the user navigate through the app.


_3u05Tpwasz.png?auto=compress%2Cformat&w=40&h=40&fit=fillmax&bg=fff&dpr=2)
Comments
Please log in or sign up to comment.