Every day, we lose around twenty-five shipping containers at sea, amounting to nearly 10,000 shipping containers a year. Although this may not seem like a lot, relative to the size of the ocean and the over 4 to 5 million shipping containers that are at say right now, over 10% of these containers are holding household chemicals that harm and damage marine life. Even with ignoring the ecological problem presented by overboard shipping containers, ten thousand missing containers represent millions in lost revenue for companies. Even when these containers fall over, the ability to locate them is relatively impossible. With over 95% of the world’s goods being shipped by sea and 250 million trips made each year, crates need to become more intelligent and monitorable.
Along with that, all those shipping containers in transit it has become increasingly complex to keep track of locations and status. In addition, loss and theft, along with customs and port authority processes can result in costly delays. At the same time, manufacturers, wholesalers, and retailers all need to increase profitability through better stock control and minimal losses.
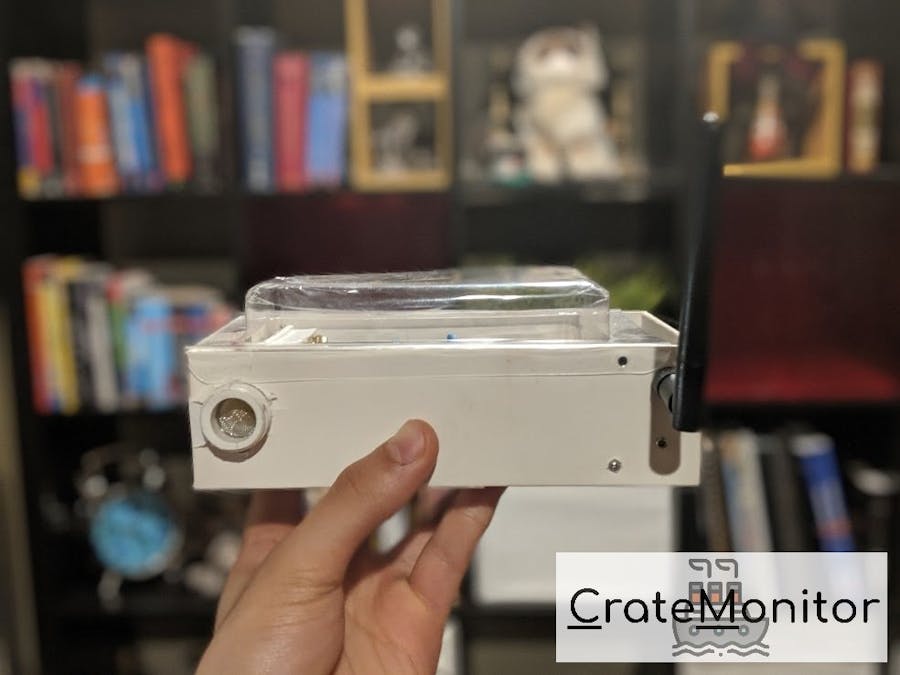
To combat this, the CrateMonitor was designed and created. The CrateMonitor was designed with the problems above in mind. With the ability to monitor temperature, gas exposure, and most importantly location, amongst other data points, it provides the user with the ability to view crucial real time data.
Key Data PointsLocation: Using Particle's Asset Tracker shield, a precise data point with the latitude and longitude is recorded and communicated to the user through the online dashboard, using the Google Maps API. This allows the user to both ensure that their shipment is on track and to track if their shipment is lost.
Temperature: Using the LM35 temperature sensor, semi-exact temperature readings can be taken from inside the container to preemptively predict any temperature problems to the user and the shipping company.
Humidity: Using the simple DHT11 Moisture Sensor, semi-exact humidity readings can be taken from inside the container to provide further insight regarding the well being of the packages being shipped.
Gas: Using the MQ2 gas sensor, an accurate representation of the presence of both combustible gas and smoke and alerting the user of their presence.
Water: Using a simple, yet effective water sensor, the presence of a liquid in the area of the sensor is immediately detected. This allows the user to know if there has been spill in their crate.
Tilt: Using a low cost tilt sensor and a complex calibration algorithm, the user is provided with an immediate alert of if their crate has tilted at all.
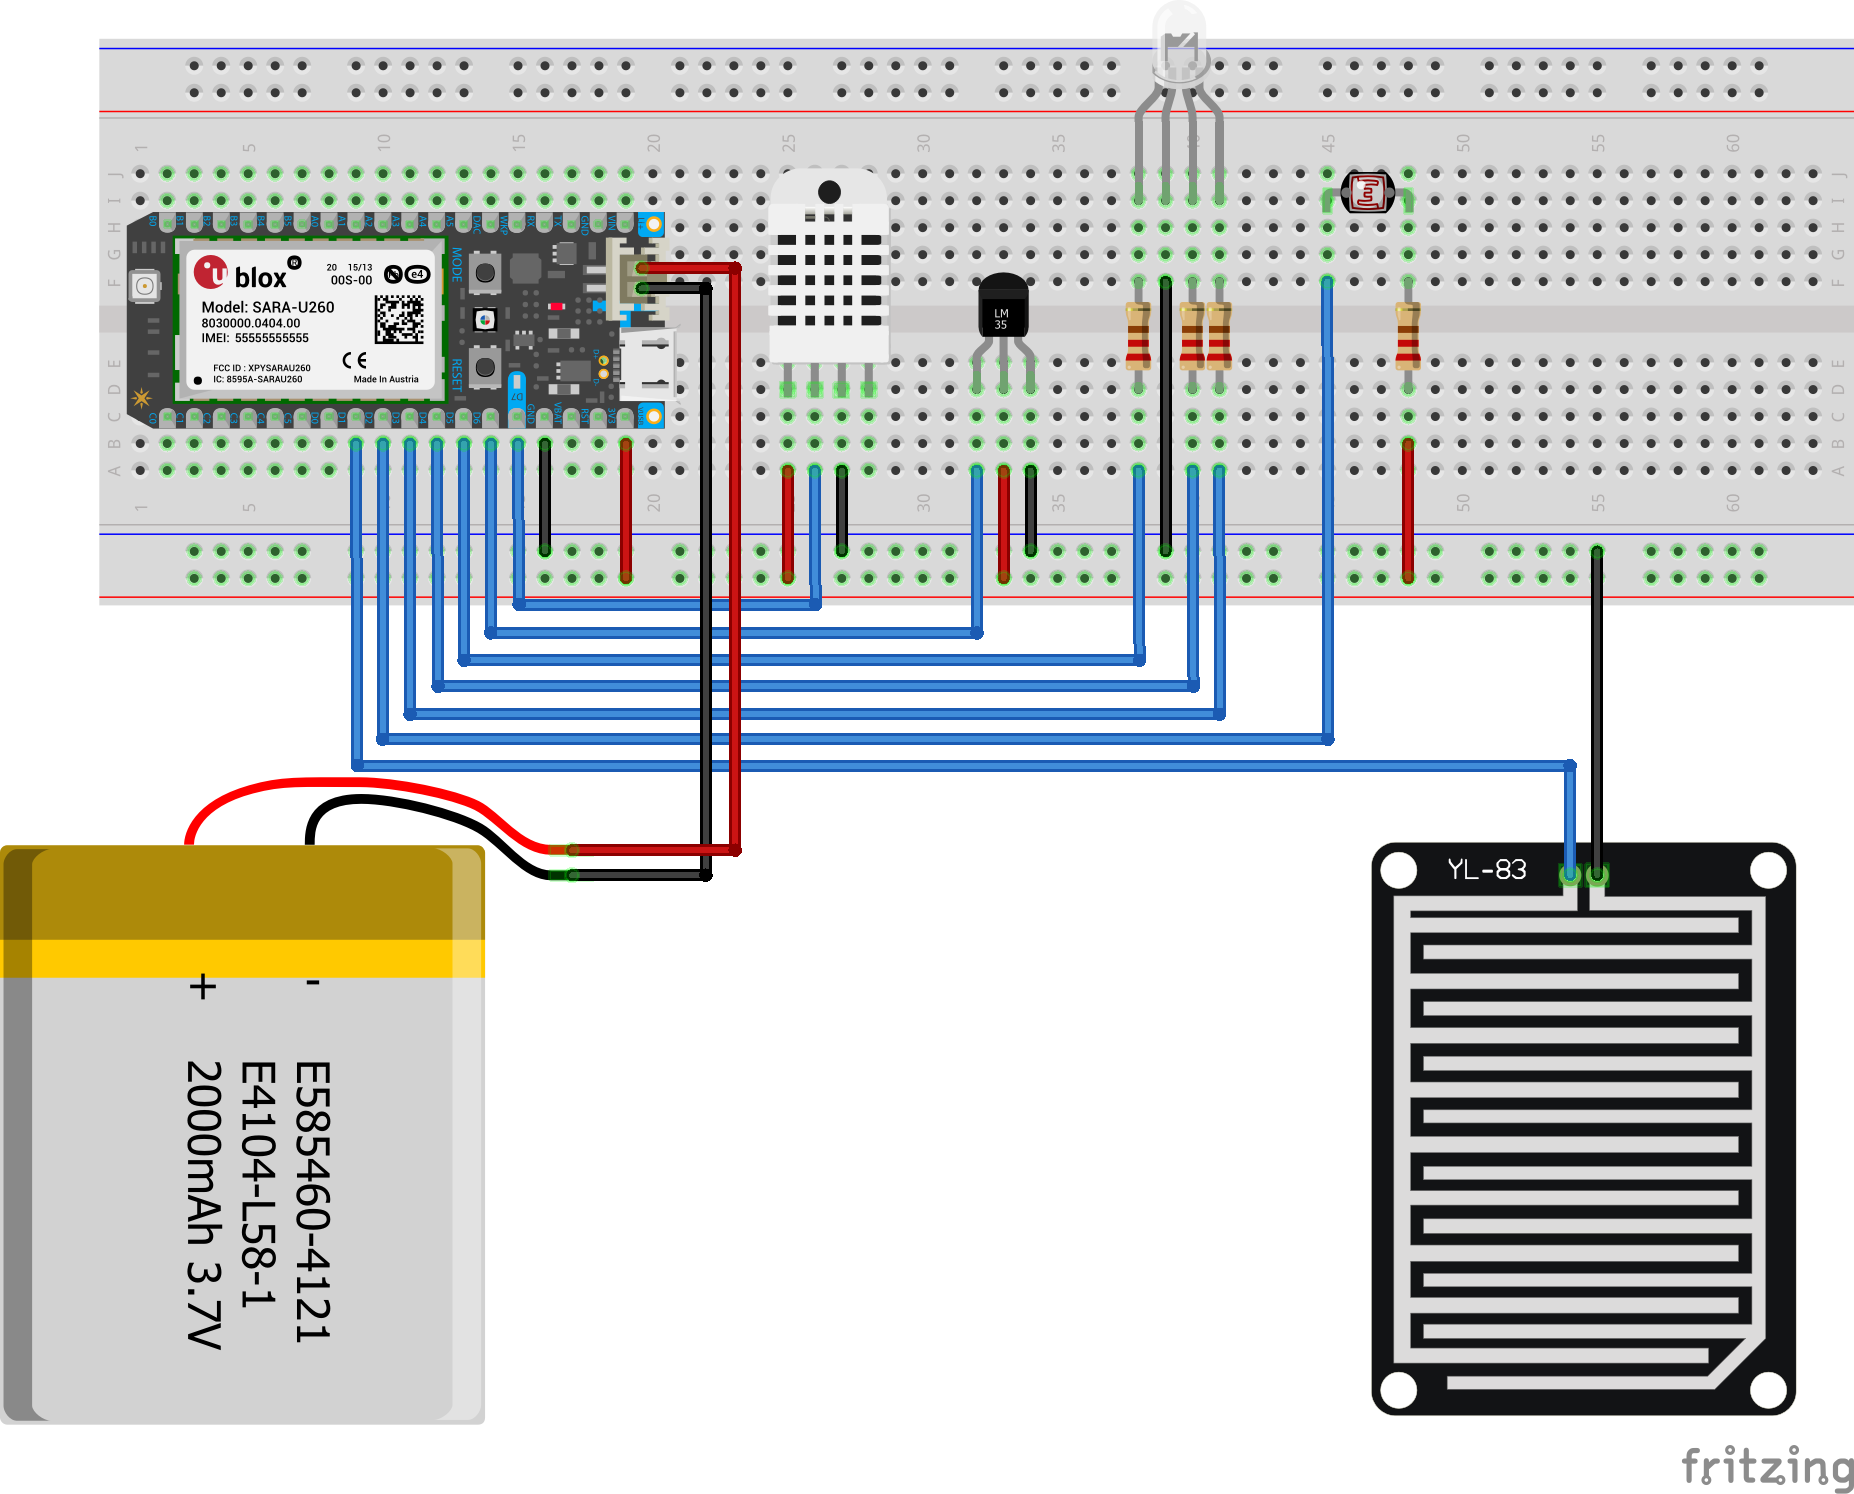
HardwareThe CrateMonitor IoT is responsible for reading data points from it's array of sensors and uploading them to the cloud CrateMonitor database. To simplify the data read and upload process, the CrateMonitor is divided into two components - a Gateway and Uplink. The Gateway is responsible for reading data from the sensors and presenting them in basic format. The Uplink is responsible for taking that data and uploading it to the cloud CrateMonitor database using the Soracom API. By employing the Particle environment of devices, the ability to change from the traditional Particle Electron, that supports 2G/3G to the new mesh network enabled Boron LTE, which also supports both 2G/3G and bluetooth. This new board would allow me to leverage the low-cost connectivity of more devices throughout the crate at a lower price point to get a more accurate representation of the crate.
The cost of the CrateMonitor IoT is approximately CAD$113.85, a breakdown of which can be found below.
The data upload algorithm is fairly simple, yet secure and easy to maintain.
- Data Read: The Particle Electron reads various data points from the variety of sensors, including the Asset Shield and tilt sensor, and stores them on the local storage to be published in the next cycle. It also employs basic analytics to understand the number of data points needed to be read and uploaded, based on the situation at hand.
- Data Published: Using the Particle Electron and the Soracom Cloud, all the data read, along with diagnostic data - such as battery life and reception quality are published to the cloud. The data is published every hour or so, depending on whether or not there is a strong connection.
- Webhook Activated: A webhook is activated, that takes the contents from the data upload and sends it via a secure encryption to the CrateMonitor Database. To combat any security or false upload problems, each device is pre-installed with a unique and secure alphanumeric 18-digit code that is sent along with the webook data to the database.
- Data Analyzed: Using a variety of in-house developed analytics tools, the data received is provided to the user in an easy to read and understand format. It is communicated through a variety of in-house developed tools and pages.
Shipment Tracker
The above page allows the user to easily track the location of the shipment in an easy to use and intuitive display screen, with data over laid on the top right corner. Numerical data readings (temperature, humidity, and tilt) are all provided in dials, whereas the presence of gas, flame, and sunlight are provided in the color of the icons below the dials. This page also uses Google's Drawing API to create curved lines between the start and end destinations.
Quick Device Information
The above page allows the user to quickly view information regarding the various devices and their shipments, as well as connection and battery issues that have arisen since they last logged on. They can also view alerts regarding pressing sensor readings and from the CrateMonitor team.
Device Information:
The above page allows the user to quickly view specific information about their device in a more comprehensive and specific manner. It communicates a variety of data points and information to the user, sparing no detail.
Add Devices and Add Shipments:
The above two screens allow the user to add a new device or CrateMonitor IoT node and to add a new shipment or shipment route, respectively. They are both fairly simple screens with dynamic dropdowns that provide continuity to the user experience. One such example is done through retrieving all active and unassigned nodes to the Add Shipment "IoT node assign" dropdown.
Device and Shipment Manifest:
The above two screens allow the user to view the manifest of all their devices or CrateMonitor IoT nodes and all their shipments or shipment routes, respectively. They are both fairly simple screens with some basic information, as well as a dropdown to view more information. They also have a button at the top that redirects them to the add device and add shipment pages.


Comments
Please log in or sign up to comment.