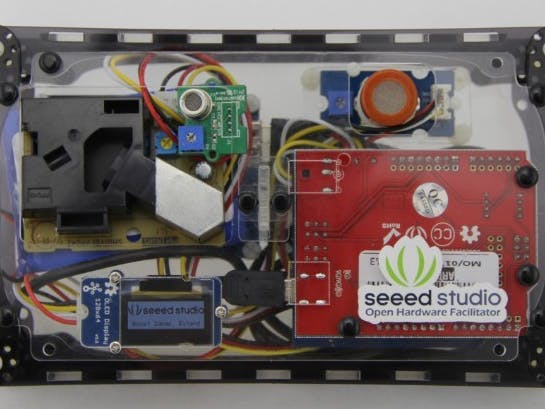
Concern is growing regarding air quality. We always get global information on the environment from our government but little on the average values of a city/area. It doesn't necessarily reflect the situation nearby accurately.
Here is a DIY-device that monitors the air quality condition around you.
This device can detect the concentration of the following ingredients of air in the room:
- Dust
- Coal gas
- Formal gas
In order to make this process faster and simpler, I chose Seeedstudio’s Grove modules and the skeleton box as a shell.
Step 1 – Materials
SeeeduinoBase ShieldGrove - Dust SensorGrove - Gas Sensor(MQ9)Grove – HCHO SensorLipo Rider pro and BatteryGrove – OLED Display 128*64Skeleton Box
Step 2 - Assembly
Connect the sensor, display and other modules to Arduino.
- Insert the base shield to the Arduino board. i
- Insert the Grove modules/sensors to the Base shield in the following order:
- Grove > OLED Display I2C port
-
Grove - Dust Sensor > Digital 8
-
Grove - Gas Sensor(MQ9) > A0/A1 port
- Grove – HCHO Sensor > A3/A4 port
Lastly, assemble the LiPo Rider Pro and battery to the acrylic panel of the skeleton box. (the acrylic panel I used is not a standard panel shipped with skeleton box. I just found it on an advertisement from a design studio, it’s easy and not expensive.
Step 3 - Programming
We need to upload the program to drive hardware. In fact, the sensors are not so convenient to use. Fortunately, Seeed has provided a demo code or library of each sensor for us. It took 1 more hour to complete programming. You can download the code right here (Github).
Unzip the “Air_Quality_Test_Box-master.zip”, get the "Air_Quality_Test_Box-master including files"
- Rename the folder “Air_Quality_Test_Box-master” to “Air_monitor”
- Copy into the sketchbook directory of the Arduino IDE assuming you already installed it
(To know where the sketchbook directory is, open Preferences)
Close and re-open the Arduino IDE if it’s open.
Navigate to the Air_monitor sketchbook.
Select the board type.
Seeeduino shares the same board type with Arduino Duemilanove w/ Atmega328. If you use another Arduino board, make sure to select the correct board type.
Connect the board to your pc with a mini USB cable.
Select the right serial port with this path: “Tools – Serial Port”
Click “upload”: after some scrolling up, “Done uploading” will show up at the status bar of Arduino IDE if everything’s right.
The OLED display will light up and display the readings of sensor.
Step 4 - Packing into box
Connect the board to the output port of the LiPo Rider Pro with a short mini USB cable.
Then put them into a box that you like (you can even make one by yourself)
All components are now packed into the skeleton box: turn on the LiPo Rider, the OLED display should show message about the air quality.
Go further
Let’s look through the software design. It’s all pointed out with one picture.
Change the logo?
You need a 128x64 image, then use the converter software to produce the C array. One of the converter software is like the LCD Assistant mentioned at http://en.radzio.dxp.pl/bitmap_converter/. Then replace the “SeeedLogo” array in the source code.
Display more?
The following functions can be used to display things at the OLED display:
SeeedOled.setTextX(unsigned char Row, unsigned char Column)
This function moves the pointer to the display. You need to call this function before any other display call except if you want to append the text after the last position.
SeeedOled.putString(const char *String)
Just like the function name, display the string onto the OLED screen.
SeeedOled.putNumber(long n)SeeedOled.putFloat(float floatNumber)SeeedOled.putFloat(float floatNumber,unsigned char decimal)
These 3 functions display number value on the screen. The parameter “decimal” of the 3rd function indicates how many digits will be displayed in the fraction part.
SeeedOled.drawBitmap(unsigned char *bitmaparray,int bytes)
This function draws a bitmap picture. The parameter “bytes” equals rows * columns /8.
Upload data to internet?
This is what can be improved. I’m going to upgrade this box someday:
- We could use a WiFi shield or an Ethernet shield to connect to the Internet
- We could upload the sensor data to one of the cloud platforms to know the air quality of a remote place
- We could view the run chart of the air quality over a long period of time (beyond what can be seen on the screen at a given time)
ye xiaobo


Comments
Please log in or sign up to comment.