1. Connect the power supply to the screw connector in the front
2. Connect an ethernet cable from the front port to your router
You should see the green indicator LED lit as well as the ethernet port LEDs showing traffic.
Connect the Sensor BridgeDo the same process to the Sensor Bridge.
1. Connect the power supply to the screw connector in the front
2. Connect an ethernet cable from the front port to your router
Again, you should see the green indicator LED lit as well as the ethernet port LEDs showing traffic.
3. Connect the T9602 sensor in place
The sensor will only be read after you send a HTTP request to the sensor.
Network connections
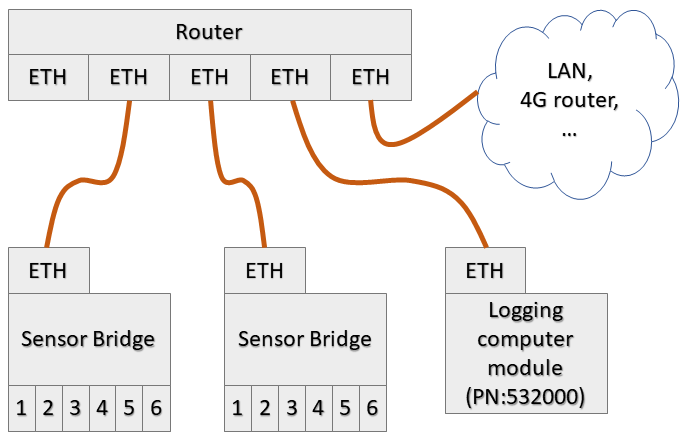
Your final connections should resemble the following architecture
Enter Sensor Bridge details
1. Browse to 192.168.1.189, which is the default IP address of the Logging Computer Module. The web page can only be accessed within the network the Logging Computer Module was connected to
2. Click on Sensors to view an empty listing
3. Click on Add New in top toolbar
4. Enter the sensor details
- Sensor name: Name the sensor, for example "S1_T9602_Rh"
- IP: Enter default Sensor Bridge IP 192.168.1.190
- Command: "T96025D1RH" for humidity"T96025D1RH" for temperature "TEMPINT" for internal temperature (handy for checking connection)
- Port: Enter default port 80
- Operation: Choose the plus sign "+".
- Operand: Enter 0.
- Unit: Unit of the measurement; %Rh or C
Enter record settings
1. Click on Records to view an empty listing
2. Click on Add New in top toolbar
- Record name: Enter a name you can recognize the measurement by
- Sample interval: Enter the desired sample interval in seconds.
- Sensor: Pick the sensor from drop-down menu
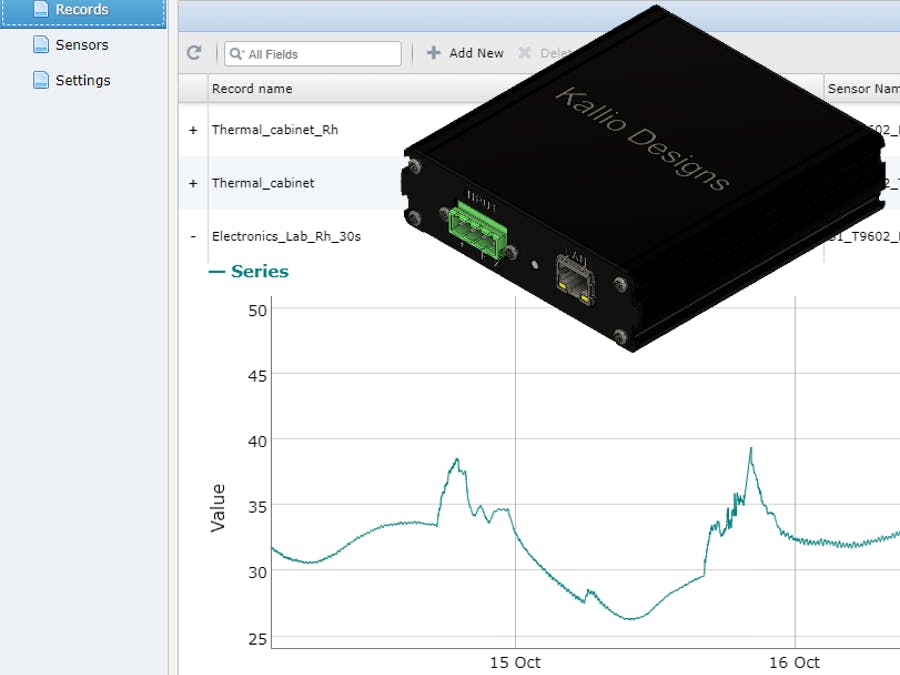
In records view you can:
- View full graphs
- Zoom into an interesting region
- View results by hovering over the graph
- Export data to CSV-file


Comments