


Hardware components | ||||||
_zhWsCcSEcl.jpg?auto=compress%2Cformat&w=48&h=48&fit=fill&bg=ffffff) |
| × | 2 | |||
 |
| × | 2 | |||
 |
| × | 8 | |||
 |
| × | 2 | |||
Software apps and online services | ||||||
 |
| |||||
Hand tools and fabrication machines | ||||||
 |
| |||||
 |
| |||||
As Juniors in Mechanical Engineering, both Cesar and I have had to do our share of studying, working, and getting ready for exams or any other task that lies in our way. Over the years of doing so, we've realized the importance of being in an environment that is conducive to such endeavors. That realization is what led us to create this project. We wanted a way for us and other students like us to know which of however many study areas they have to choose from is the most conducive to their learning. In order to do so, we thought of what data measurements would be the most helpful in choosing the right study space. We tossed around several like noise level and UV index, but in the end, we settled on temperature and humidity. These two measurements were both convenient to measure together and the two things most people are likely to complain about when doing a task.
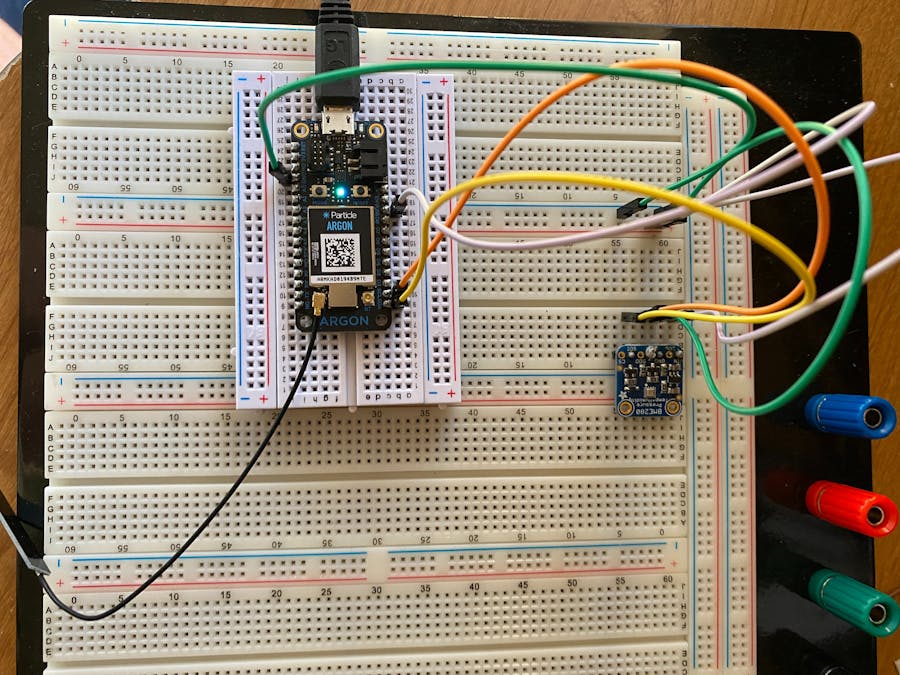
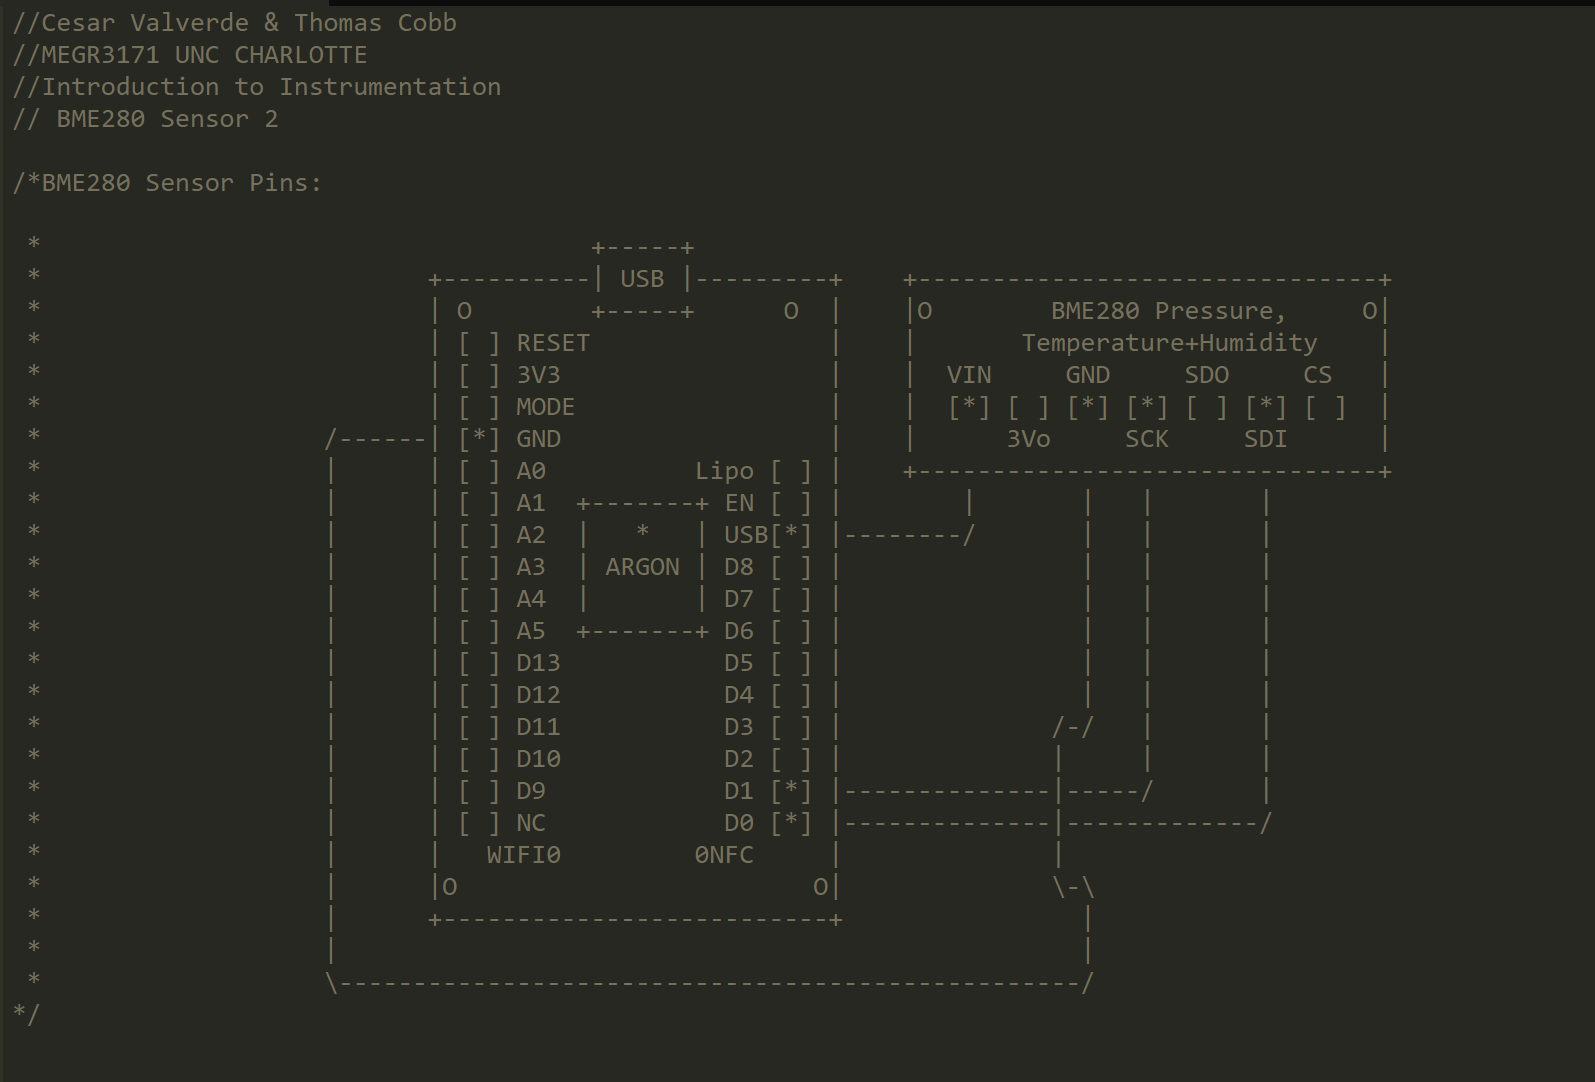
In order to do these measurements and connect it to the internet as the Internet of Things title suggests, we decided on using a Particle Argon and an Adafruit BME 280 sensor which measures temperature, humidity, barometric pressure, and approximate altitude altogether. The sensor and Argon were very easy to connect, as no in-depth wiring was needed. The only thing left was the code.
The code looks all complicated and confusing if you don't know how to read it but what is actually going on is quite the opposite. In simple terms, one Argon would take the 4 measurements listed above and publish them. The second Argon would then subscribe to the data the first Argon had published. The second Argon would then take the same measurements itself and compare the results to that of the first Argon. Whichever Argon has the measurement closer to the desired measurement would then be sent the task of turning on the blue LED light. This process is repeated every 20 minutes so that we have an accurate result without producing an overwhelming amount of data.
Along with the presents of the LED light at the more desirable study location, the data is also linked to ThingSpeak link where it is graphed as the data comes in so if you want to look into the past, compare real-time data, or simply see what measurements are being taken at that time, you can simply go to the ThingLink page for either Argon and see what trends and data points are being produced.
This process could be made to go even more in-depth by adding more sensors or programming it to send certain texts to you depending on the measurements and how they compare but since both Casar and I have had little exposure to this topic we chose not to overwhelm ourselves while still producing a product that works to solve the problem we had.
As some of this might be hard to picture using just words, we have created a short youtube video that is linked below to show a little bit better what our project does, how it does it, and what results come from it.
Thomas Cobb Thingspeak Data:
https://thingspeak.com/channels/1244918
Cesar Valverde Thingspeak Data:
https://thingspeak.com/channels/1244908
To display the data from particle publish to Thingspeak, you will need to open up the integrations menu on the particle console. For use to the two separate channels, we created two integrations with the same setup, only varying the particle and published event. Once editing the web integration, you will need to click on 'Advanced Settings' and fill out the custom form fields with your unique write API key.


Comments
Please log in or sign up to comment.