


Hardware components | ||||||
 |
| × | 1 | |||
 |
| × | 1 | |||
 |
| × | 1 | |||
| × | 1 | ||||
| × | 1 | ||||
 |
| × | 1 | |||
 |
| × | 1 | |||
Software apps and online services | ||||||
| ||||||
During Covid-19 pandemic the german government launched an application for mobile phones (in German: "CoronaWarnApp"). The main goal of this app is to identify and track Covid-19 encounters in a privacy preserving way. In order to do so, mobile phones exchange anonymised bluetooth beacons when they are close enough to each other. When a person gets a positive diagnosis with Covid-19 and signifies so inside the app, all other users of the app, which where close enough for a period of time in the last [X days] get a notification of a possible Covid-19 encounter and eventually can get them tested. As one focus is the anonymised tracking of encounters, there is no data about where and when this app is actually used at. The aim of this project is to measure the deployment of the CoronaWarnApp at public locations.
Overview of general workflowThe general workflow in order to use the BLE Scanner and visualize the results afterwards in the accompanying WebUI is as follows:
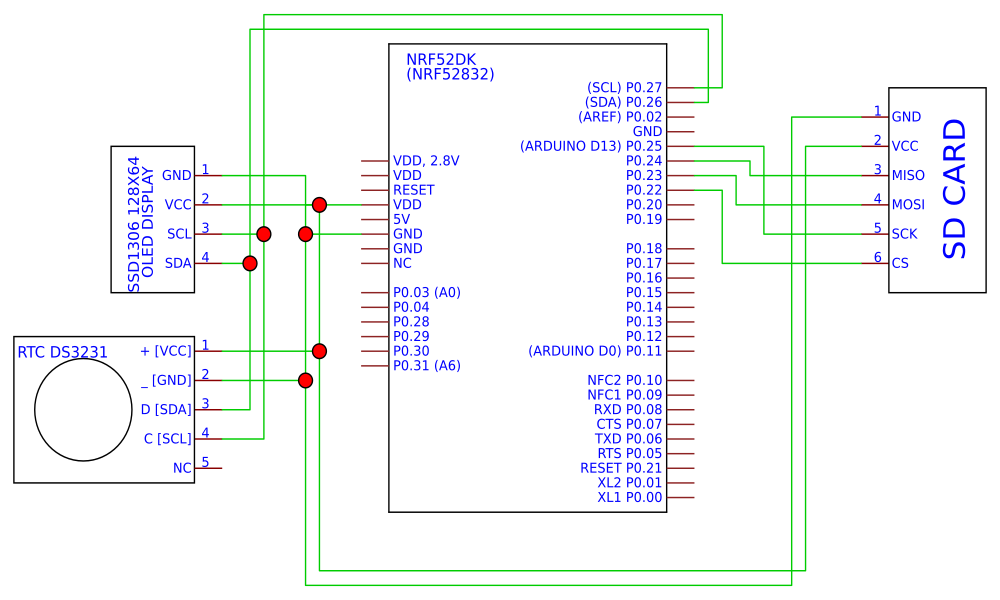
1. Connect all the jumper wires from the microcrontoller to all the needed pheripheral devices as indicated in the Schematics
2. Flash the RIOT based scanner code to the device
3. Install the Android app on a device of your choice
4. Start the flashed microcontroller
5. Whilst in "GPS Mode", send the GPS coordinates from the location you want to start scanning from your phone to the microcontroller
6. Change to "Scanner Mode" with the buttons of the microcrontroller
7. Repeat step 4-6 for every new location you want to take measurements
8. Build the WebUI together with the Front End on your machine with a simple Docker-Compose command
9. Take the SD-Card out of the reader and plug it into your machine. Copy the Log Files (including the "GPS" file) over.
10. Explore the different visualizations from your measurements in the WebUI
This steps are just intendet to give an overview of the general steps to be done. In the following the steps from the general workflow will be further explained with some explanations of the code. More technical details can be also found in the linked GitHub repo.
1. Connect Jumper WiresConnect all the jumper wires from the microcrontoller to all needed pheripheral devices as indicated in the Schematics.
2. Flash the application to the MicrocontrollerIn our setup we used the provided way through vagrant, which easily allows to reproduce the complete dev environment.
Step 1: Start vagrant (navigate to the folder of the repo on your machine)
vagrant upStep 2: Log in to the vagrant instance
vagrant sshStep 3: When logged into vagrant, navigate to the ricorder folder, which is where the application lives
cd SWP_IoT_Corona/ricorder/Step 4: Connect the microcontroller via USB to your PC and turn it on. Then flash the application
make all flashThe preferred way to install the android app ist to build from the repository, and sign and install it using Android Studio. Alternatively it is possible to build the app using gradle and install an unsigned build using the sdk platform tools and the developer mode on the smart phone.
Using Android Studio
After installing Android Studio, you can import the project by selecting the option Open an Existing project, navigating to the CoronaWarnAppScannerSetup folder and clicking OK.
To build a signed APK, you need to click on Build in the navigation bar and select Generate Signed Bundle / APK. We need to select the option APK because we want to deploy the only version of this app to one device.
Next, you need to create a new keystore with a key, if you don't already have one. key store path, password and key alias can be chosen after clicking on Create new.... With that you can select the release build variant and use the V2 signature Scheme to sign the app.
After the compilation, the generated module can be easily located using the Message found in the bottom left of the project window. If there the message does not show up as a pop-up, it can also be found using the Event Log, can also be opened in the bottom left or using the navigation bar under View -> Tool Windows -> Event Log.
The apk file can now be installed after transfering it to the phone.
Using Gradle
It is also possible to build the project without installing Android Studio by using gradle to build a release build.
Using a Debug Build
It ist also possible to create an unsigned apk that has to be installed using dev tools. With the SDK Platform Tools you can use the Android Debug Bridgeadb to install a debug build on an Android Phone that has enabled the developer options and USB debugging. It is also possible to use WiFi for debugging.
apps can then be installed using
adb install -t <path to apk>When the microcontroller is started you will firstly see a menu, in which you can choose which mode to take. Set the microcontroller to "GPS Mode" by pressing the indicated button. Then you can send the GPS coordinates from your android device to the microcontroller as showed in the video.
By changing the microcontroller to "Scanner Mode" you can start scanning.
9. Copy the dataTake the SD-Card out of the reader and plug it into your machine. Copy the Log Files (including the "GPS" file) over.
10. Visualizing Measurements through the Web UIWe built a web UI that includes an Angular frontend as well as a Python backend. In the web UI you can upload the logfiles that the scanner creates and analyze the data using many different visualizations.
The main purpose of the Python backend (in the directory cwa-scanner-backend) is to receive and store the data that is uploaded in the frontend, as well as to compute all the different aggregations of the data that are needed for the visualizations in the frontend. The Python application consists of a simple Flask server exposing different HTTP endpoints. All the endpoints are defined in the src/server.py file. The server also uses Swagger, an API specification tool. When sending a request to a certain HTTP endpoint (/api/spec), the server will dynamically generate a Swagger specification based on the endpoint that it currently exposes. You can also view this specification and play around with it in the frontend.
The directory /src/tools contains the main functionality of the application. In adparser.py, the scanner logfiles are parsed such that from each line in a logfile, which represents a received BLE packet, an object is created that contains all the information about the packet, i.e. address, address type, time, RSSI value and payload. These objects can then be used by the code in data_handling.py, where all aggregations of the data are computed.
The Angular frontend (in the directory cwa-scanner-webui) is used to upload and visualize the raw and aggregated data so that it can be analyzed. On the main page of the web interface, data can be uploaded and one out of many visualization pages can be selected.
The Angular application is built in such a way that (almost) every page contains as little code as possible, i.e. only the functionality that is needed for the specific page. To this end, these pages use the chart component (src/app/chart), which provides a ready-to-use linechart or barchart including styling etc. A page that wants to display a chart can use this component and only needs to provide a method that constructs the chart data in the correct way. Using this architecture, pages with new visualizations can easily be added without having to duplicate a lot of code.
The frontend application also includes a page that contains the SwaggerUI, which displays the above-mentioned Swagger specification of the backend API. On this page, every endpoint and all the information about it can be inspected. Furthermore, the endpoints can be used directly within the SwaggerUI, including providing parameters and data for the HTTP requests.
For an overview of which files you have uploaded, you can use the "Uploaded data" menu in the upper right. In this menu, you can delete uploaded files as well as toggle their visibilty for the visualizations. Furthermore, you can click "Add data" to upload new data just like on the main page.
To give a good impression on what is possible with the frontend application, we will present a few of the visualizations that are available and how they can be utilized to draw conclusions from the recorded data.
To gain a first overview of how "crowded" the place you recorded the data at is, you can use the "Packets per interval" page. It shows how many packets your board received in each interval from the beginning to the end, including how many of these packets were Corona-Warn-App packets (meaning they use the Google/Apple Exposure Notification API) and how many were not. The interval is configurable with by a slider at the bottom of the page.
If you want to take a closer look at the percentage of CWA packets, you can use the "CWA share per interval" page, which shows you exactly this value, again for a configurable interval, respectively.
Since different devices might advertise in smaller or higher intervals, the information given by the above-displayed page might be misleading. To this end, there exists another page ("Share of CWA devices"), which displays the share of devices, identified by address, that sent CWA packets in each interval. This potentially gives a better overview of how many Corona-Warn-Apps were used in the area were you recorded your data.
If you want to get a sense of how close to you (or rather your board) the other devices were on average while you recorded the data, you can use the "Average RSSI value per interval" page. It displays the average signal strength (RSSI) of each packet in each interval. If you toggle "Relative time scale", the time on the x-axis is relative to the beginning of recording instead of an absolute value (e.g. "100s since start" instead of "20.03.2021, 15:02:01"), so that you can even compare the data from multiple files in one chart.
If you want to analyze your data on a very fine-grained level, you can use the "Device info" page, that displays a table where each row represents one device (identified by address) from which your board received at least one packet. The table displays a lot of information about the packets that were received from this device, including minimum, maximum and average RSSI value, and the advertising interval. When you click on a row, a simple chart opens that shows the RSSI trend of the corresponding device.
Ultimately, you can compare you measurements spacially on the "Map" page. In order to use the map page, you have to provide your own Google Maps API key in the /src/index.html file: Just replace <GOOGLE_MAPS_API_KEY> with your API key in the following script:
<script defer src="https://maps.googleapis.com/maps/api/js?key=<GOOGLE_MAPS_API_KEY>&libraries=visualization"></script>Once this is done, you also have to upload the GPS data to the frontend. To this end, just open the "GPS data" menu in the upper right and select the GPS file that your board automatically created. Your data recordings will now show up on the map. The intensity of each spot (how "red" it is) on the map is determined by the amount of Corona-Warn-App packets that were received during the respective recording.
Side note: The results of each aggregation that is computed is cached in the backend so that the data can be fetched much more quickly when it is needed again after already having been computed.
Implementation detailsThe scanner application is structured into the following modules:
stor: storage -> initializing and writing to the SD cardui: user interface -> initializing and feeding the OLED displaywallclock: time keeping -> initializing and querying the RTC modulescanner(part of RIOT): control NimBLE to do the actual BLE scanningmodi: functionality of the different modes of the applicationservices: a GATT server that can receive GPS location datamain: glue all the modules together and run a low-prio thread that triggers updating the UI and writing the scan buffer to the SD card
Main
The main modules initializes the display, the SD card, the RTC and the GATT server and configures the hardware interrupts for the buttons using gpio_init_int(...). It then starts an endless while-loop which constantly checks the current_state variable and runs the appropiate code once the state changes.
Modes
This module runs the code for each of the three modes (menu, scanner, gps). When in GPS mode, it also toggles a few LEDS on the microcontroller as a visual indicator.
Storage
The storage module mainly manages the storing of data on the external SD card. It uses the virtual filesystem (VFS) layer provided by RIOT and mounts a FAT filesystem to the location /f on the SD card. In the function save_gps_location(file_name,latitude,longitude), the previously received GPS location is stored in the GPS file, together with the current filename for the scanner data. The stor_flush() function is called periodically when the application is in the scanner mode and it flushes all the packets that were received in the last time period to the SD card, formatted as one line, respectively.
Clock
This module manages the real-time clock using the DS3231 driver provided by RIOT. It can return provide the current (UTC or local) time with wallclock_time(), wallclock_time_local() or wallclock_now(secs,msecs). To set the correct real-world time on the RTC, the function wallclock_set_time(time) is used.
Display
The UI module manages the content that is shown on the LED display using the U8G2 library for monochrome displays. It contains a few functions that display predefined content for the different modes of the application as well as a function that displays any given message in one line on the screen.
GATTserver
This module runs a BLE GATT (General Attribute) server that is used to receive GPS location data from an Android smartphone. It also provides the device info services that is necessary to find the microcontroller inside the Android app. When the GPS location data is received (latitude and longitude separately), it is stored in the GPS file (see storage module).
Scanner
The scanner module provides the main functionality of the application: the scanning for BLE packets. It utilizes the NimBLE stack provided by RIOT. The callback, that is triggered every time a BLE packets is received, formats the line that is to be written to the SD card. It includes the timestamp, address, address type, RSSI value and advertising data.
Android App
The android app uses Hilt for dependency injection and Lifecycle-Aware Components and Kotlin flows to structure the application. With these libraries, it is possible to Inject a ViewModel into the main fragment without much boilerplate code. Interaction with the Gatt Server is implemented in the ScannerRepository class using the Objects and methods from the android.bluetooth module.


Comments
Please log in or sign up to comment.