


Hardware components | ||||||
 |
| × | 1 | |||
 |
| × | 1 | |||
 |
| × | 1 | |||
 |
| × | 1 | |||
| × | 1 | ||||
 |
| × | 1 | |||
Software apps and online services | ||||||
 |
| |||||
 |
| |||||
 |
| |||||
| ||||||
| ||||||
| ||||||
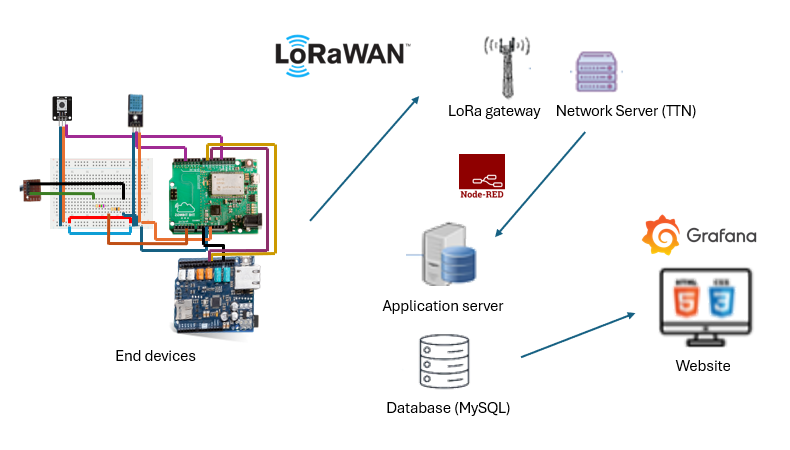
The Internet of Things (IoT) is revolutionizing various industries by enabling seamless connectivity and data exchange between physical devices. LoRa (Long Range) technology are commonly used in IoT deployments, providing long-distance communications with low power consumption. In this project, we take an in-depth look at the IoT system architecture utilizing LoRa technology, covering the entire process from object connection to data visualization.
Integration of IoT with LoRatechnology
First, we need to develop a device with several sensors and actuators which is the environment network device. For the device, The Things Uno, Arduino with Arduino shield, a DHT-11, USB cable, push button will be used. The device will be able to check the environment conditions, internet status, power status, and the button status.
The DHT-11 sensor captures environmental temperature and humidity values. Additionally, the USB cable monitors power supply status, detecting whether it is active or inactive. Furthermore, it detects button status, triggering a notification message upon button press. Moreover, the Arduino Shield facilitates internet connectivity and verifies internet availability.
For the LoRa communication, The Things Uno with LoRa module will be able to send those receive data to the LoRa network and transmit them to the network server (TTN). Furthermore, the device created with The Things Uno must be first register on The Things Stack. Generate new DevEui, Device address, AppSKey, and NwkSKey for the device to complete the registration for the device.
When the device registration is complete, use Arduino IDE to compile it for the connection between the device and the network server (TTN). If the server is available and everything is good, those payload messages will be sent with uplink messages to The Things Network.
After those data transmitted to the network server, I use Node-Red to send and store the data in the database (MySQL). First, deploy a MQTT node for connecting the related network server (TTN). Then, deploy a database node to store the data into MySQL database. Moreover, the msg.topic must hole the query data for the database, so a function node is needed to define those query data as msg.topic.
In the next session, which is the data visualization part, I use Grafana solution to create dashboards and embed them in HTML websites. In the Grafana server, you need to first connect to your database for including the data from your database. After the database connections, I included some data for visualization to make the dashboards.
Finally, the dashboard can be embed in HTML website. To embed the dashboard from the Grafana server, the <iframe> element is needed. By including <iframe>, we can include the dashboard in the HTML website, and it is synchronize with the Grafana server. There are some examples for the website below.
As we can see from the figure above, there are some other data included. Well, those are some additional data getting from other devices. There is a door sensor device that can monitor the door status, door opening duration, and some other values. Moreover, the weather data is get on the OpenWeatherMap by using API key.
ResultsThe environment network device has been positioned and tested indoors. The dashboard of the environment network device displays an overview of temperature and humidity in a week. As we can see the room's temperature typically fluctuates between 18 to 22 Celsius degrees, while humidity remains around 95 percent. Additionally, there are several statuses monitored on the dashboard, including button press, USB connection, network connectivity, and message delivery types. The first test shows periodic messaging with USB plugged in, indicated by a USB status of 4V and message status of 0. The second test shows a button press, updating the button status to 1 and message status to 1. The third test shows a temperature change with the network connected, marking the internet status as 1 and message status as 2. In the fourth test, the USB status changes upon internet connection, resulting in a USB status of 4V, internet status of 1, and message status of 3. Finally, the last test shows a change in internet status with USB plug-in, resulting in a USB status of 4V, internet status of 0, and message status of 4.
ConclusionThis project is an overall about Internet of Things (IoT) with the environment network device using LoRa technology and the process from the object connections to the data visualization. The architecture of IoT systems with LoRa technology is a robust framework for enabling connectivity and data exchange in multiple applications. By using the long-range communication capabilities and low-power operation of LoRa, IoT deployments can overcome traditional limitations and extend connectivity to remote and challenging environments. From object connection to data visualization, each component of the architecture plays a vital role in enabling the flow of information, driving insights, and facilitating informed decision-making. As IoT continues to evolve, advancements in architecture and technology will further enhance the scalability, reliability, and efficiency of LoRa-enabled deployments, unlocking new possibilities across industries and shaping the future of connected ecosystems.
AcknowledgementsI would like to thank professor Nicolas Dailly who guiding me to complete this project for my bachelor graduation report, as well as Beijing Institute of Technology for providing me opportunity to do my project in UniLaSalle Amiens. I am very appreciate that I have a chance to do this IoT project. In this project, I have gain many knowledge in IoT and LoRa technology.
UniLaSalle Amiens, France: https://www.unilasalle-amiens.fr/
Beijing Institute of Technology: https://english.bit.edu.cn/


Comments
Please log in or sign up to comment.