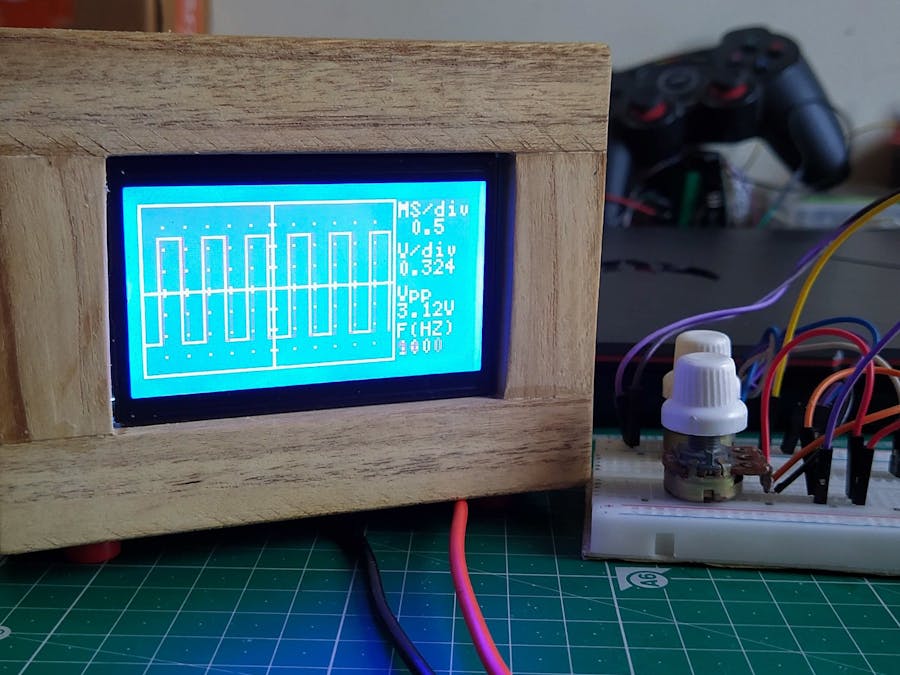
You've almost certainly drawn charts in school. Many of them show how a certain quantity of something (like a heart rate, the price of a corporation's shares, or a country's exchange rate) changes over time. They have the quantity plotted in the vertical direction (known as the y-axis) and the time period plotted in the horizontal direction (the x-axis).The trouble with charts like this is that they can take ages to plot—unless, of course, you happen to be an oscilloscope!
It's a handy little gadget that draws charts automatically using signals you feed into it from the probes hooked up to an electronic circuit/Function generator.
Let's Make itStep #1: Building The Enclosure
When I gathered all the electronic components It's time to build an enclosure for the oscilloscope. Well, I don't have a 3D printer so I decided to build a wooden enclosure. I went to the carpenter shop and bought few balsa sticks, sandpaper, hacksaw, and fevicol. Then I measured the height and width of the LCD and build a rectangular frame for that.
This will be the front of our oscilloscope. And for the back part, with the help of a hacksaw, I cut down the balsa sticks into pieces and joined them with fevicol to make a rectangular wooden box.
After completing this. Now it's time to provide a very nice & neat wooden texture to the enclosure.
I fixed sandpaper on the table with the help of electric tape. And start rubbing all the wooden parts on the sandpaper until they become smooth and shinier.
After 25-30 minutes of rubbing, I got a very nice and smooth-looking enclosure for my Oscilloscope.
Step #2: Understanding the working(Code logic)
When you attach a mini digital oscilloscope probe to an electronic circuit the analog-to-digital converter (ADC) of Atmega328p microcontroller samples the signal at discrete points with some delay(T) in time and converts the signal's voltage at these points to digital values called sample points. The horizontal system's sample clock determines how often the ADC takes a sample.The rate at which the clock "ticks" is called the sample rate and is measured in samples per second.The sample points from the ADC are stored in memory of the microcontroller as waveform points. More than one sample point may make up one waveform point.Together, the waveform points make up one waveform record. The number of waveform points used to make a waveform record is called the record length. When we press Div +ve switch sampling delay(T) increases so the gap between sample points will increase as a result waveform appeared zoomed out and vice versa. The voltage value of the sample point which is having the maximum analog value out of all the sample points stored in the memory is the Peak voltage of the captured waveform. And the inverse of the sampling rate will be the Frequency of the waveform.
The display receives these record points after being stored in the memory and displays it as a captured waveform on the DISPLAY WAVEFORM area ((0, 0), (95, 63)) and simultaneously on the DISPLAY WAVEFORM INFO area ((96, 63), (127, 63)) parameters (like frequency of the waveform, peak voltage of the waveform, etc) are displayed.


Comments
Please log in or sign up to comment.