A few months ago I found a problem, how do I know what clothing is appropriate for the weather while I am getting dressed. Being the budding maker that I am I spent the next few weeks researching, designing, and building a device to display the daily forecast and help me figure out what to wear. This was my first original Arduino project so it took a while, but I learned so much along the way.
Setting Up the Open Weather MapTo start the process of creating a Forecast Display you first must sign up for a free Open Weather Map Account. This allows you to request weather data from the OWM (Open Weather Map) API.
To set up the OWM API, follow the link above and create an account. Next, sign in and click on 'API keys', locate the key of your default API key, this will become important later.
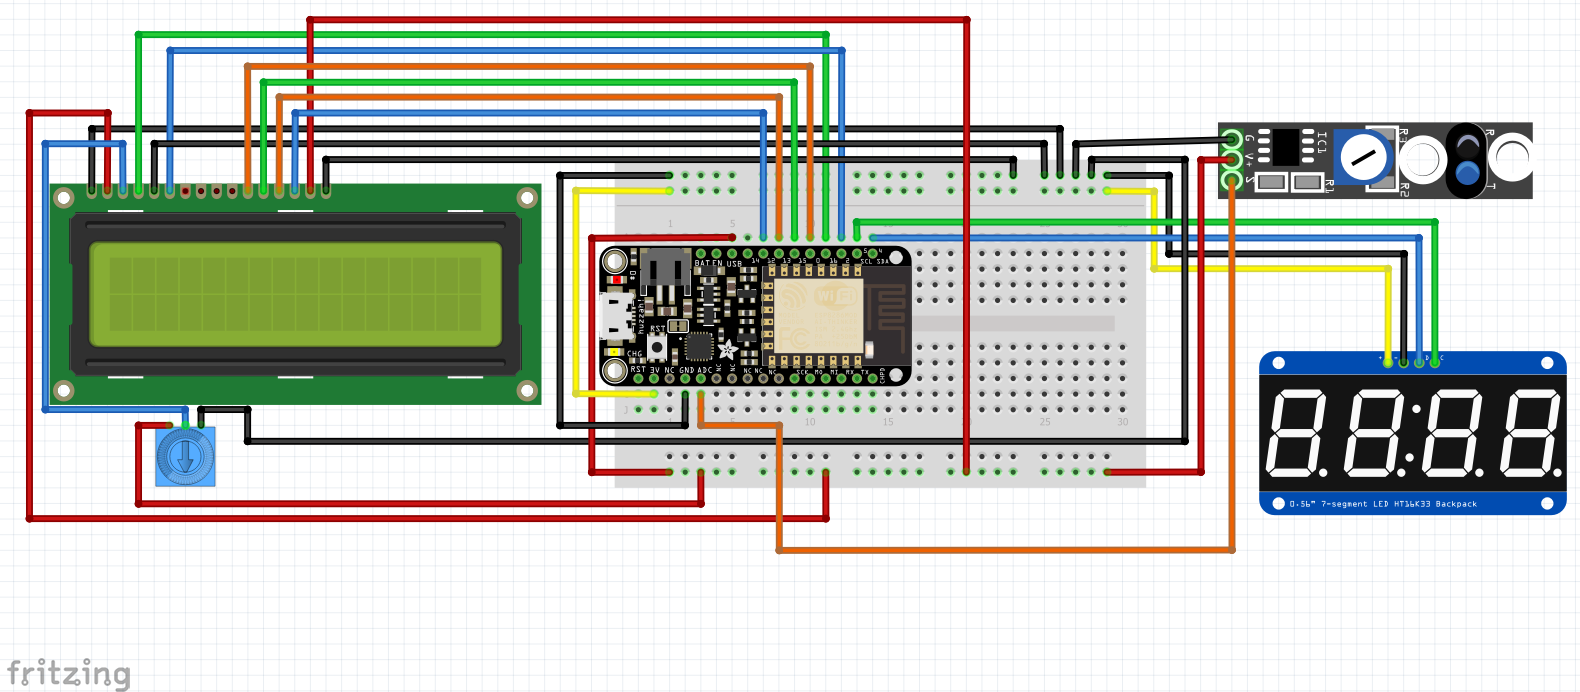
Electronics ChoicesFor this project I decided to use the Adafruit Feather ESP8266 Huzzah micro controller. I chose it because it could request data from the WU API and boasted many GPIO pins. The daily forecasted high and low temperatures are displayed on an Adafruit .56" 4-digit 7-Segment display to ensure that they can be read from a distance. I also decided to add a 16x2 standard LCD display to show the date and a quick summary of the forecasted weather. A line tracking module was included to switch between pages of information, but is optional for core functionality.
Assembly- Gather materials
- 3D print all 3 peices to the enclosure, the 'mounting plate' will not be visible so that may be printed in any color.
- Attach the Adafruit Feather to the half sized breadboard. Stick the breadboard to the bottom of the enclosure so that the feather lines up with the central USB hole.
- Connect everything according to the circuit diagram ensuring that wires for the LCD, 7 segment display, and line sensor pass through the mounting plate.
- Mount the LCD and line sensor to the mounting plate using screws and place the 7 segment atop its pegs.
- Snap the case together by placing the mounting plate in the base and then the cover on top.
To start you must have an updated Arduino IDE which is found here.
The programming for the Forecast Box requires a few external libraries which must be downloaded and placed into the right folders. First of all the Feather drivers must be taken care of. Download them here.
Next, we add esp8266 support to the Arduino IDE. This is done by entering http://arduino.esp8266.com/stable/package_esp8266com_index.json into Additional Board Manager URLs field in the Arduino preferences.
Make sure under the tools menu that you have selected: 80mhz CPU frequency, 4M flash size, and 115200 upload speed. Go to here and follow the directions listed under software to install the LED and GFX libraries
ProgrammingTo get your Forecast Display up and running start by connecting it to your computer using a micro-b USB cord. Select the COM port of the Feather and paste the code linked HERE into the Arduino IDE. You must enter some variables so that the Forecast Display can forecast correctly. Find the User Settings section of the code and input your wifi and location information as well as the API key acquired earlier. You will also need the WTAPILocation which is acquired by going here and securing your current location from towards the top. The User settings also include preferences for date and temperature which may be changed to suit you.
Once that is done, the time has come to bring your display to life. Upload the Arduino sketch by clicking the forward arrow at the top of the IDE.
UsageIf everything runs smoothly you should have a functioning weather forecast display. Whenever the board is being uploaded to, some random characters may appear. By placing your finger over the line sensor, you may scroll through pages of information. The fully functional pages are currently date and time, and weather forecast. If at any point you feel that the Forecast Display is not working correctly, simply put your finger over the sensor to reset the display.
PagesDate and Time: displays the current date,centered on the LCD screen, as well as the current time on the 7 segment matrix, factoring in preferences.
Weather Forecast: Displays the highest temperature in the next 24 hours on the left 2 digits of the 7 segment matrix, and the lowest temperature on the right. The LCD displays a guide to interpreting the matrix, as well as the current date.
FutureIn the future I would like to add more pages of information which could be scrolled through with the sensor. I am looking to add capability for many data points: Stocks, current weather, news headlines, countdown until holidays, and much more. I hope this project is well received, if you have any questions or comments feel free to comment. This was my first project so I am sure it can be improved upon, if you have any suggestions please leave them in the comments as well.


_3u05Tpwasz.png?auto=compress%2Cformat&w=40&h=40&fit=fillmax&bg=fff&dpr=2)

Comments