As the picture above, we cut 2 grove lines for I2C communication, so that Wio LTE can connect to LCD Grove and PM2.5 Sensor Grove at the same time. You can use an I2C Hub to achieve that either.
And don't forget, connect LTE antenna to Wio LTE and plug your SIM card to it.
Web ConfigureClick here to login or register a PubNub account, it will be used for transmit real-time data.
In PubNub Admin Portal, you will see a Demo Project. Enter the project, there have 2 keys, Publish Key and Subscribe Key, remember them for Software Programming.
Software ProgrammingPart 1. Wio LTE
Because there is no PubNub library for Wio LTE, we can publish our real-time data via HTTP request, see PubNub REST API Document.
To make a HTTP connection from your SIM card pluged to Wio LTE, you should set your APN first. If you don't know that, please contact your mobile operator.
And set your PubNub Publish Key, Subscribe Key and Channel after setting APN. A Channel here, is used to differentiate Publishers and Subscribers, Subscribers will receive data from Publishers who have same Channel.
Press and hold Boot0 button in Wio LTE, connect it to your computer via an USB cable, upload the code in Arduino IDE to it. After uploading, press RST button to reset Wio LTE.
Part 2. Web Page
Turn to PubNub, enter Demo Keyset, and click Debug Console on the left, it will open a new page.
Fill your channel name to Default Channel text box, then click Add Client button. Wait for a while, you will see PM1.0, PM2.5 and PM10 value appear in Debug Console.
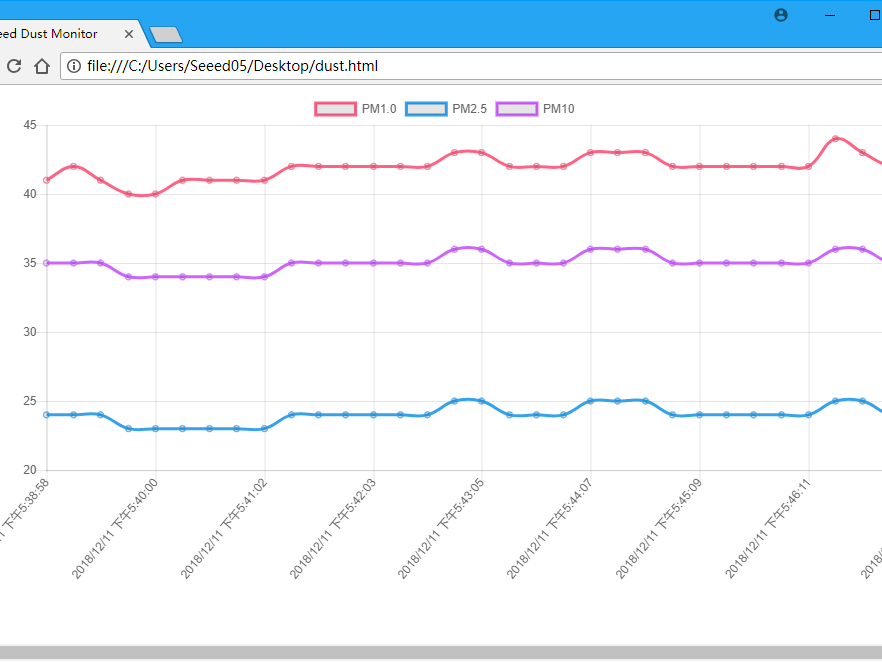
But it's not friendly to us, so we consider to display it as chart.
First at all, create a new html file in your computer. Open it by a text editor, add basic html tags to it.
   <html>
       <head>
       </head>
       <body>
       </body>
   </html>
Then add PubNub and Chart.js's script to head, you can also add a title to this page.
   <head>
       <title>Seeed Dust Monitor</title>
       <script src="https://cdn.pubnub.com/sdk/javascript/pubnub.4.21.6.js"></script>
       <script src="https://cdnjs.cloudflare.com/ajax/libs/Chart.js/2.7.3/Chart.js"></script>
   </head>
There should be a place to display a chart, so we add a canvas to page's body.
   <body>
       <canvas id="chart"></canvas>
   </body>
And add script tag so that we can add javascript to subscribe real-time data and draw the chart.
   <body>
       <!-- ... -->
       <script>
       </script>
   </body>
To subscribe real-time data from PubNub, there should has a PubNub object,
   var pubnub = new PubNub({
       publishKey: "<your_publish_key>",
       subscribeKey: "<your_subscribe_key>"
   });
and add a listener to it.
   pubnub.addListener({
       message: function(msg) {
       }
   });
The message member in parameter msg of function message is the data we need. Now we can subscribe real-time data from PubNub:
   pubnub.subscribe({
       channel: ["dust"]
   });
But how to display it as chart? We created 4 arrays to keep real-time data:
   var chartLabels = new Array();
   var chartPM1Data = new Array();
   var chartPM25Data = new Array();
   var chartPM10Data = new Array();
Among them, chartLabels array is used to keep data reached time, chartPM1Data, chartPM25Data and chartPM10Data are used for keeping PM1.0 data, PM2.5 data and PM10 data respectively. When real-time data reaches, push them to arrays separately.
   chartLabels.push(new Date().toLocalString());
   chartPM1Data.push(msg.message.pm1);
   chartPM25Data.push(msg.message.pm25);
   chartPM10Data.push(msg.message.pm10);
Then display the chart:
   var ctx = document.getElementById("chart").getContext("2d");
   var chart = new Chart(ctx, {
       type: "line",
       data: {
           labels: chartLabels,
           datasets: [{
               label: "PM1.0",
               data: chartPM1Data,
               borderColor: "#FF6384",
               fill: false
           }, {
               label: "PM2.5",
               data: chartPM25Data,
               borderColor: "#36A2EB",
               fill: false
           }, {
               label: "PM10",
               data: chartPM10Data,
               borderColor: "#CC65FE",
               fill: false
           }]
       }
   });
Now open this html file with web browser, you will see data changes.


Comments
Please log in or sign up to comment.