The drive for this project was the inspiration from (my opinion) a well known YouTuber, which presents electronics circuits, projects, and electronics basics videos (how capacitors, inductors, MOSFETs, etc.). Below you can see this project implemented using an Arduino board with the same sensor and OLED display, but with a few differences and all integrated on a PCB.
My implementation of this project uses the following components:
- Raspberry Pi 3
- INA219 current sensor
- 128x64 SSD1306 OLED display
The reason why I used Raspberry Pi platform is because most of the time I code in Python and it was easier for me to use the 5V pins of the Raspberry to supply voltage to the sensor and display. I used the picture below to map which pins to connect to the breadboard.
The reason for using the I2C protocol (Inter-Integrated Circuit ) is that is very common, there are a lot of libraries written for this protocol that support a lot of integrated circuits. I will not make the project longer by explaining how the protocol works, we are just interested in connecting the modules so they can communicate with the Raspberry Pi 3 which will be the master in these communication scheme.
If you want to understand how the protocol works, I recommend reading this article from SparkFun, I found it very helpful and in depth: SparkFun I2C Protocol Tutorial.
INA219 Current Sensor
This breakout board will solve all your power-monitoring problems. Instead of struggling with two multimeters, you can just use the handy INA219B chip on this breakout to both measure both the high side voltage and DC current draw over I2C with 1% precision.
This description is taken from Adafruit's INA219 HIGH SIDE DC CURRENT SENSOR BREAKOUT product page and you can go to the link to see the full description, tehnical details and examples using an Arduino board or CircuitPython.
In a nutshell, the basic working principal of this board is that you connect your supply voltage to the Vin+ pin, the Vin- pin in series with the load, which is connected to the ground. On the board there is a 0.1 ohm shunt resistor which will draw an amount of current, which is then feed to a programmable gain amplifier and passed to an ADC circuit. After the current, voltage and power values are calculated they are passed to an I2C interface for further use.
Although I find the description a little dramatic, the sensor can measure up to +26 DC voltage and maximum 3.2 amps with a 0.8 mA precision & a voltage drop of 320 mV over the 0.1 ohm shunt resistor. So for loads that have a supply voltage higher than 26 DC voltage, or if you have a higher precision, you should use a different sensor.
The pins on which we are going to focus for this project are:
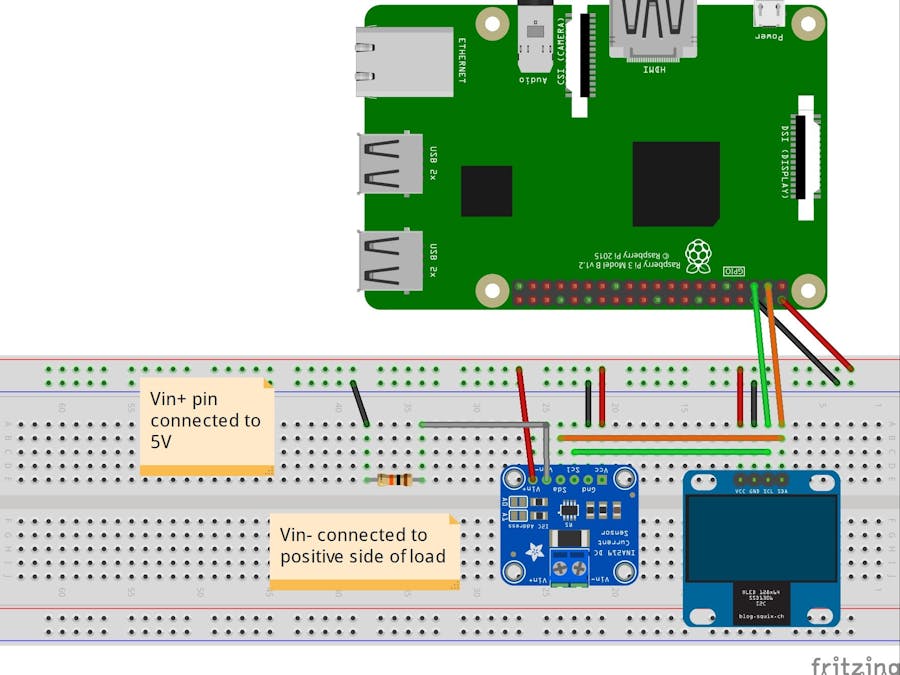
- Pin 2 - 5V supply voltage
- Pin 3 - I2C SDA line
- Pin 4 - I2C SCL line
- Pin 9 ( or any pin labeled GND on the schematic) - GND potential
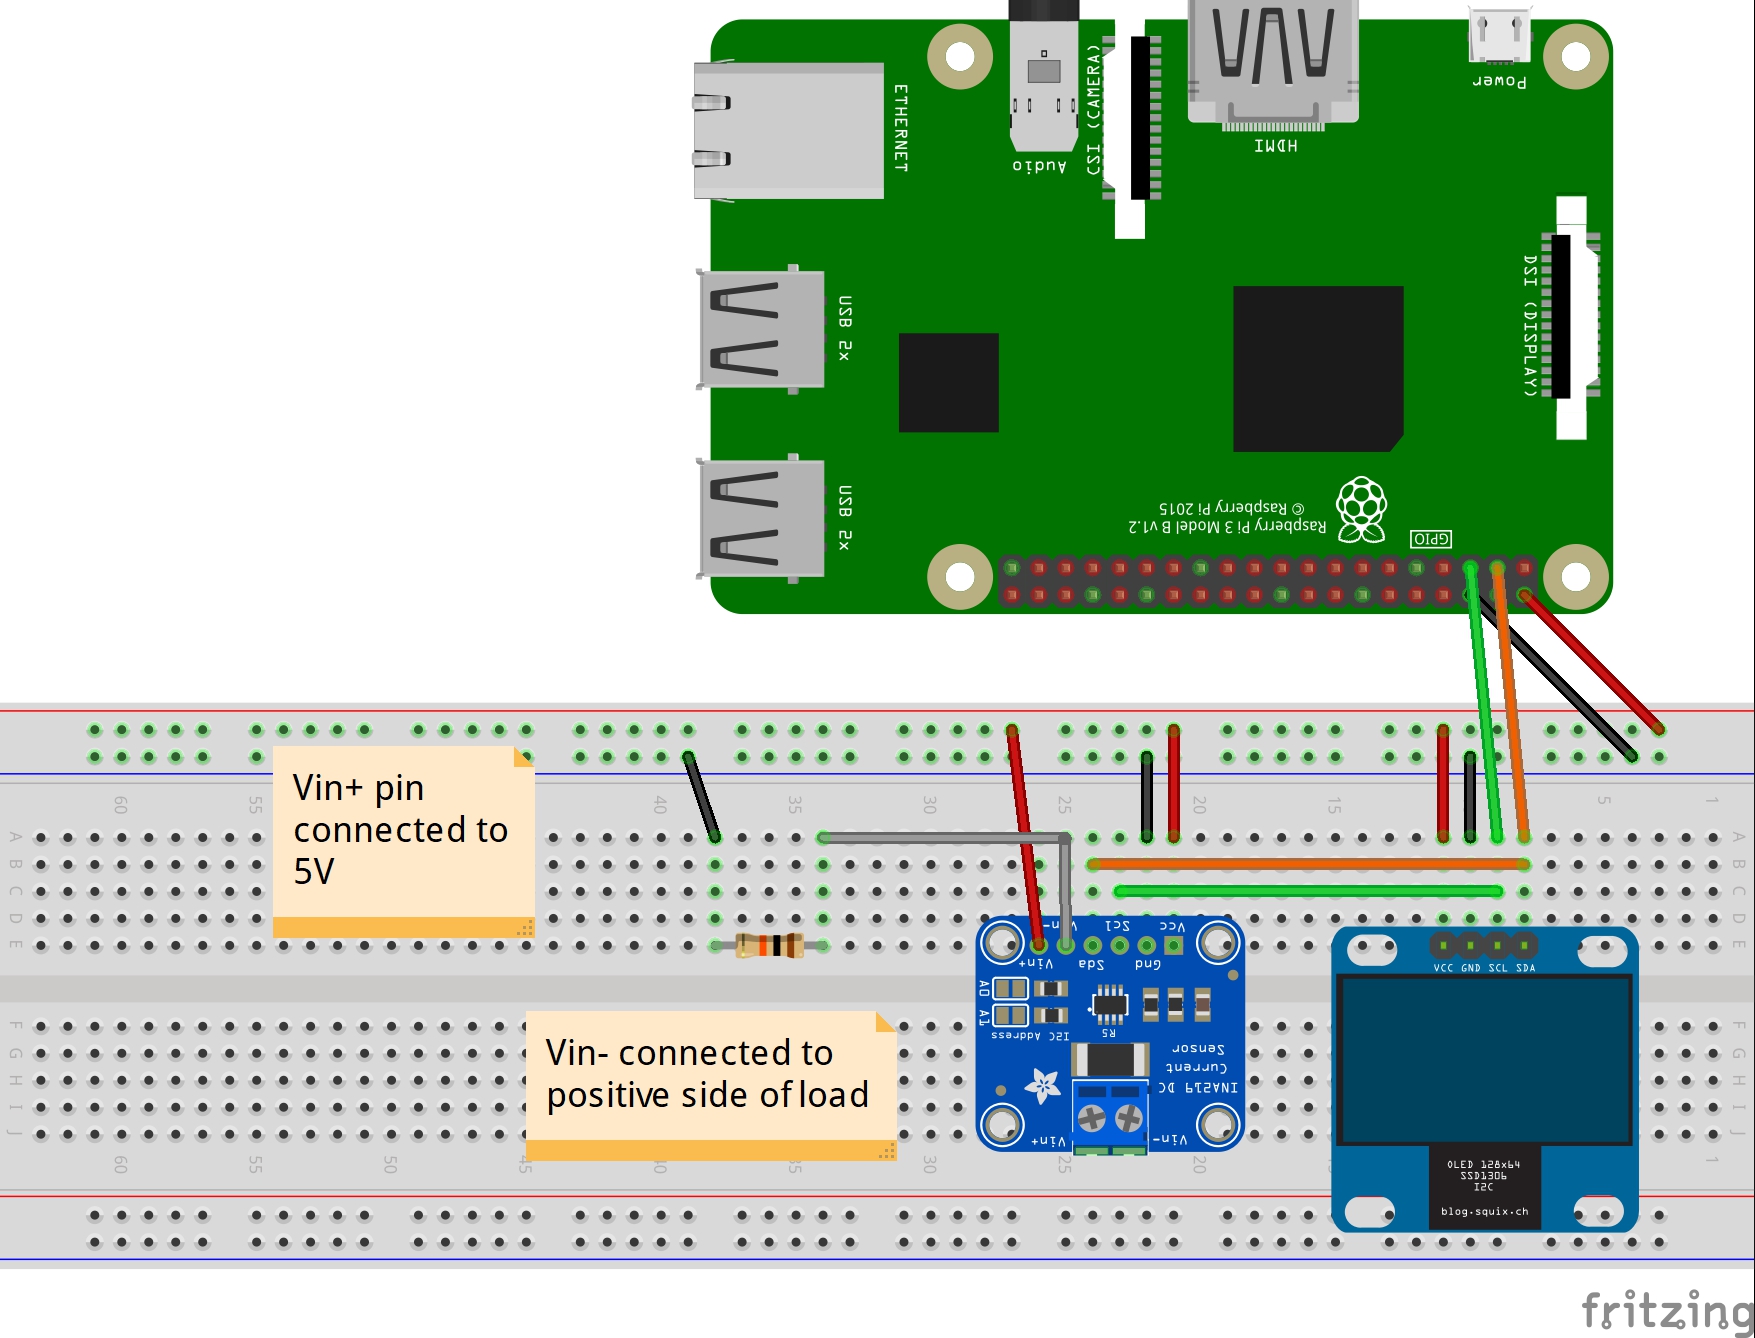
Below you can see the connections in the Frizting schematics I made. We will use the Raspberry Pi to send and read data over I2C, but also as a 5V power supply.
Necessary Python LibrariesAdafruit_SSD1306 GitHub repository:
sudo pip install Adafruit-SSD1306 # command for installing the library using pip
ina219 github repository:
sudo pip install pi-ina219
openpyxl library for created the Workbook where the data will be written
sudo pip install openpyxl
Don't forget to enable the I2C bus on the Raspberry Pi:
Go to Start button in the upper left corner -> Preferences -> Raspberry Pi Configuration. In the opened window click on the Interfaces tabs and click on the Enabled radio button next to the I2C label.
The first step in the code is to configure the ina219 sensor to what specific shunt resistor it uses. In our case in the already built-in 0.1 ohm resistor.
# Configure INA219 sensor
ina = INA219(SHUNT_OHMS)
ina.configure() # this is the default call for the configure function, but it can be called with different parameters, depending on the supply voltage you are using, the precision you want or the shunt resistor used
The SSD1306 object disp = SSD1306_128_64(rst=RST) will be used to control what is displayed. I create a black rectangle which will act as the refresh frame between reads.
The font used to display data is assigned in this statement: font = ImageFont.truetype('Minecraftia-Regular.ttf', 8)
I got the file from this website where you and find a bunch more of fonts if you want to use something else. The file has to be in the same folder with the source code, otherwise an exception that the file can't not be found will be thrown.
After this a workbook is created and I edited which column will display a specific data.
wb = Workbook()
ws = wb.active
ws.title =  'Sensor Output'
ws['A1'] = 'Bus Voltage (V)'
ws['B1'] = 'Bus current (mA)'
ws['C1'] = 'Power (mW)'
ws['D1'] = 'Shunt Voltage (mV)'
ws['E1'] = 'Load Voltage (V)'
The logic is inserted in a try-except-finally statement. The statement will run the loop in the try declaration in which the data will be read from the sensor and appended to the workbook. There are two except statements: one in case the voltage over the sensor is higher then expected and the other one for stopping the script.
In the finnally statement, the display is closed by drawing a black rectangle, the charts for load voltage, bus current, and power are created and saved in the workbook.
Running ExamplesOn the first run, I measured the power consumption over a 10 Kohm resistor to see that every is configured correctly and the sensor works as expected.
And the outputed graphs and values.
Because we are using the Raspberry Pi as a voltage supply, we can see that it fluctuates over time. But the results are as expected, and we are seeing a power consumption of 2.5 mW and a current draw of 0.5 mA.
I made 2 more setups using an LED and a FTDI serial to USB breakout board.
I attached all the excel files that were creating when using these three setups.
ConclusionThe sensor is easy to use and has a lot of libraries created already to ease the work. Configured accordingly, it delivers precise values and can be used for larger appliances. The data recorded in the Excel file is handy to see how much current your appliance consume and can be further used to send it to a cloud account and have a live data feed.


Comments
Please log in or sign up to comment.