

Hardware components | ||||||
 |
| × | 1 | |||
| × | 1 | ||||
 |
| × | 1 | |||
 |
| × | 1 | |||
Software apps and online services | ||||||
 |
| |||||
| ||||||
| ||||||
| ||||||
 |
| |||||
The government declared the following rules for manufacturing tablets/medicine in all pharmaceutical companies :
- While the manufacturer is allowed to maintain the temperature of the tablets between, -40 and -30 degrees Celsius, the temperature of the tablets should never remain between -33 and -30 degrees for longer than 20 minutes at a time.
- Also, the manufacturer should maintain a log of when the cooling chamber for the production of the tablets is opened.
- These rules should be implemented within a month of their declaration. Failing to comply would lead to cancellation of the pharmaceutical production permit.
While the government declared these rules to ensure that the medicine produced at all pharmaceutical companies, was good enough to be used by the general public.
This project is related to solving the problem that is faced by many pharmaceutical companies i.e. they have no automated alert system that alert the people responsible for management of cooling the chamber at a certain range of temperature. Because of temperature going below the lower threshold or going above the upper threshold value will cause the damage to tablets or medicine and that will cause a huge lose to the pharmaceutical companies.
The pharmaceutical companies use a cooling chamber which is similar to a refrigerator to keep the tablets and maintain the temperature in the required limits. However, since we don’t have a cooling chamber which can maintain a temperature in the range, of -40 to -30 degrees Celsius, you can instead use a regular refrigerator at your home for this project.
Project Objectives :-A. Build the circuit for temperature monitoring system, using the Bolt and LM35 sensor.
B. Create a product on the Bolt Cloud, to monitor the data from the LM35, and link it to your Bolt.
C. Write the product code, required to run the polynomial regression algorithm on the data sent by Bolt.
D. Keep the temperature monitoring circuit inside your fridge with the door of the fridge closed, and let the system record the temperature readings for about 2 hours.
E. Using the reading that you received in the 2 hours, set boundaries for the temperature within the fridge.
F. Write a python code which will fetch the temperature data, every 10 seconds, and send out an email alert, if the temperature goes beyond the temperature thresholds you decided on in Objective “E”.
G. Modify the python code, to also do a Z-score analysis and print the line “Someone has opened the fridge door” when an anomaly is detected.
H. Tune the Z-score analysis code, such that, it detects an anomaly when someone opens the door of the fridge.
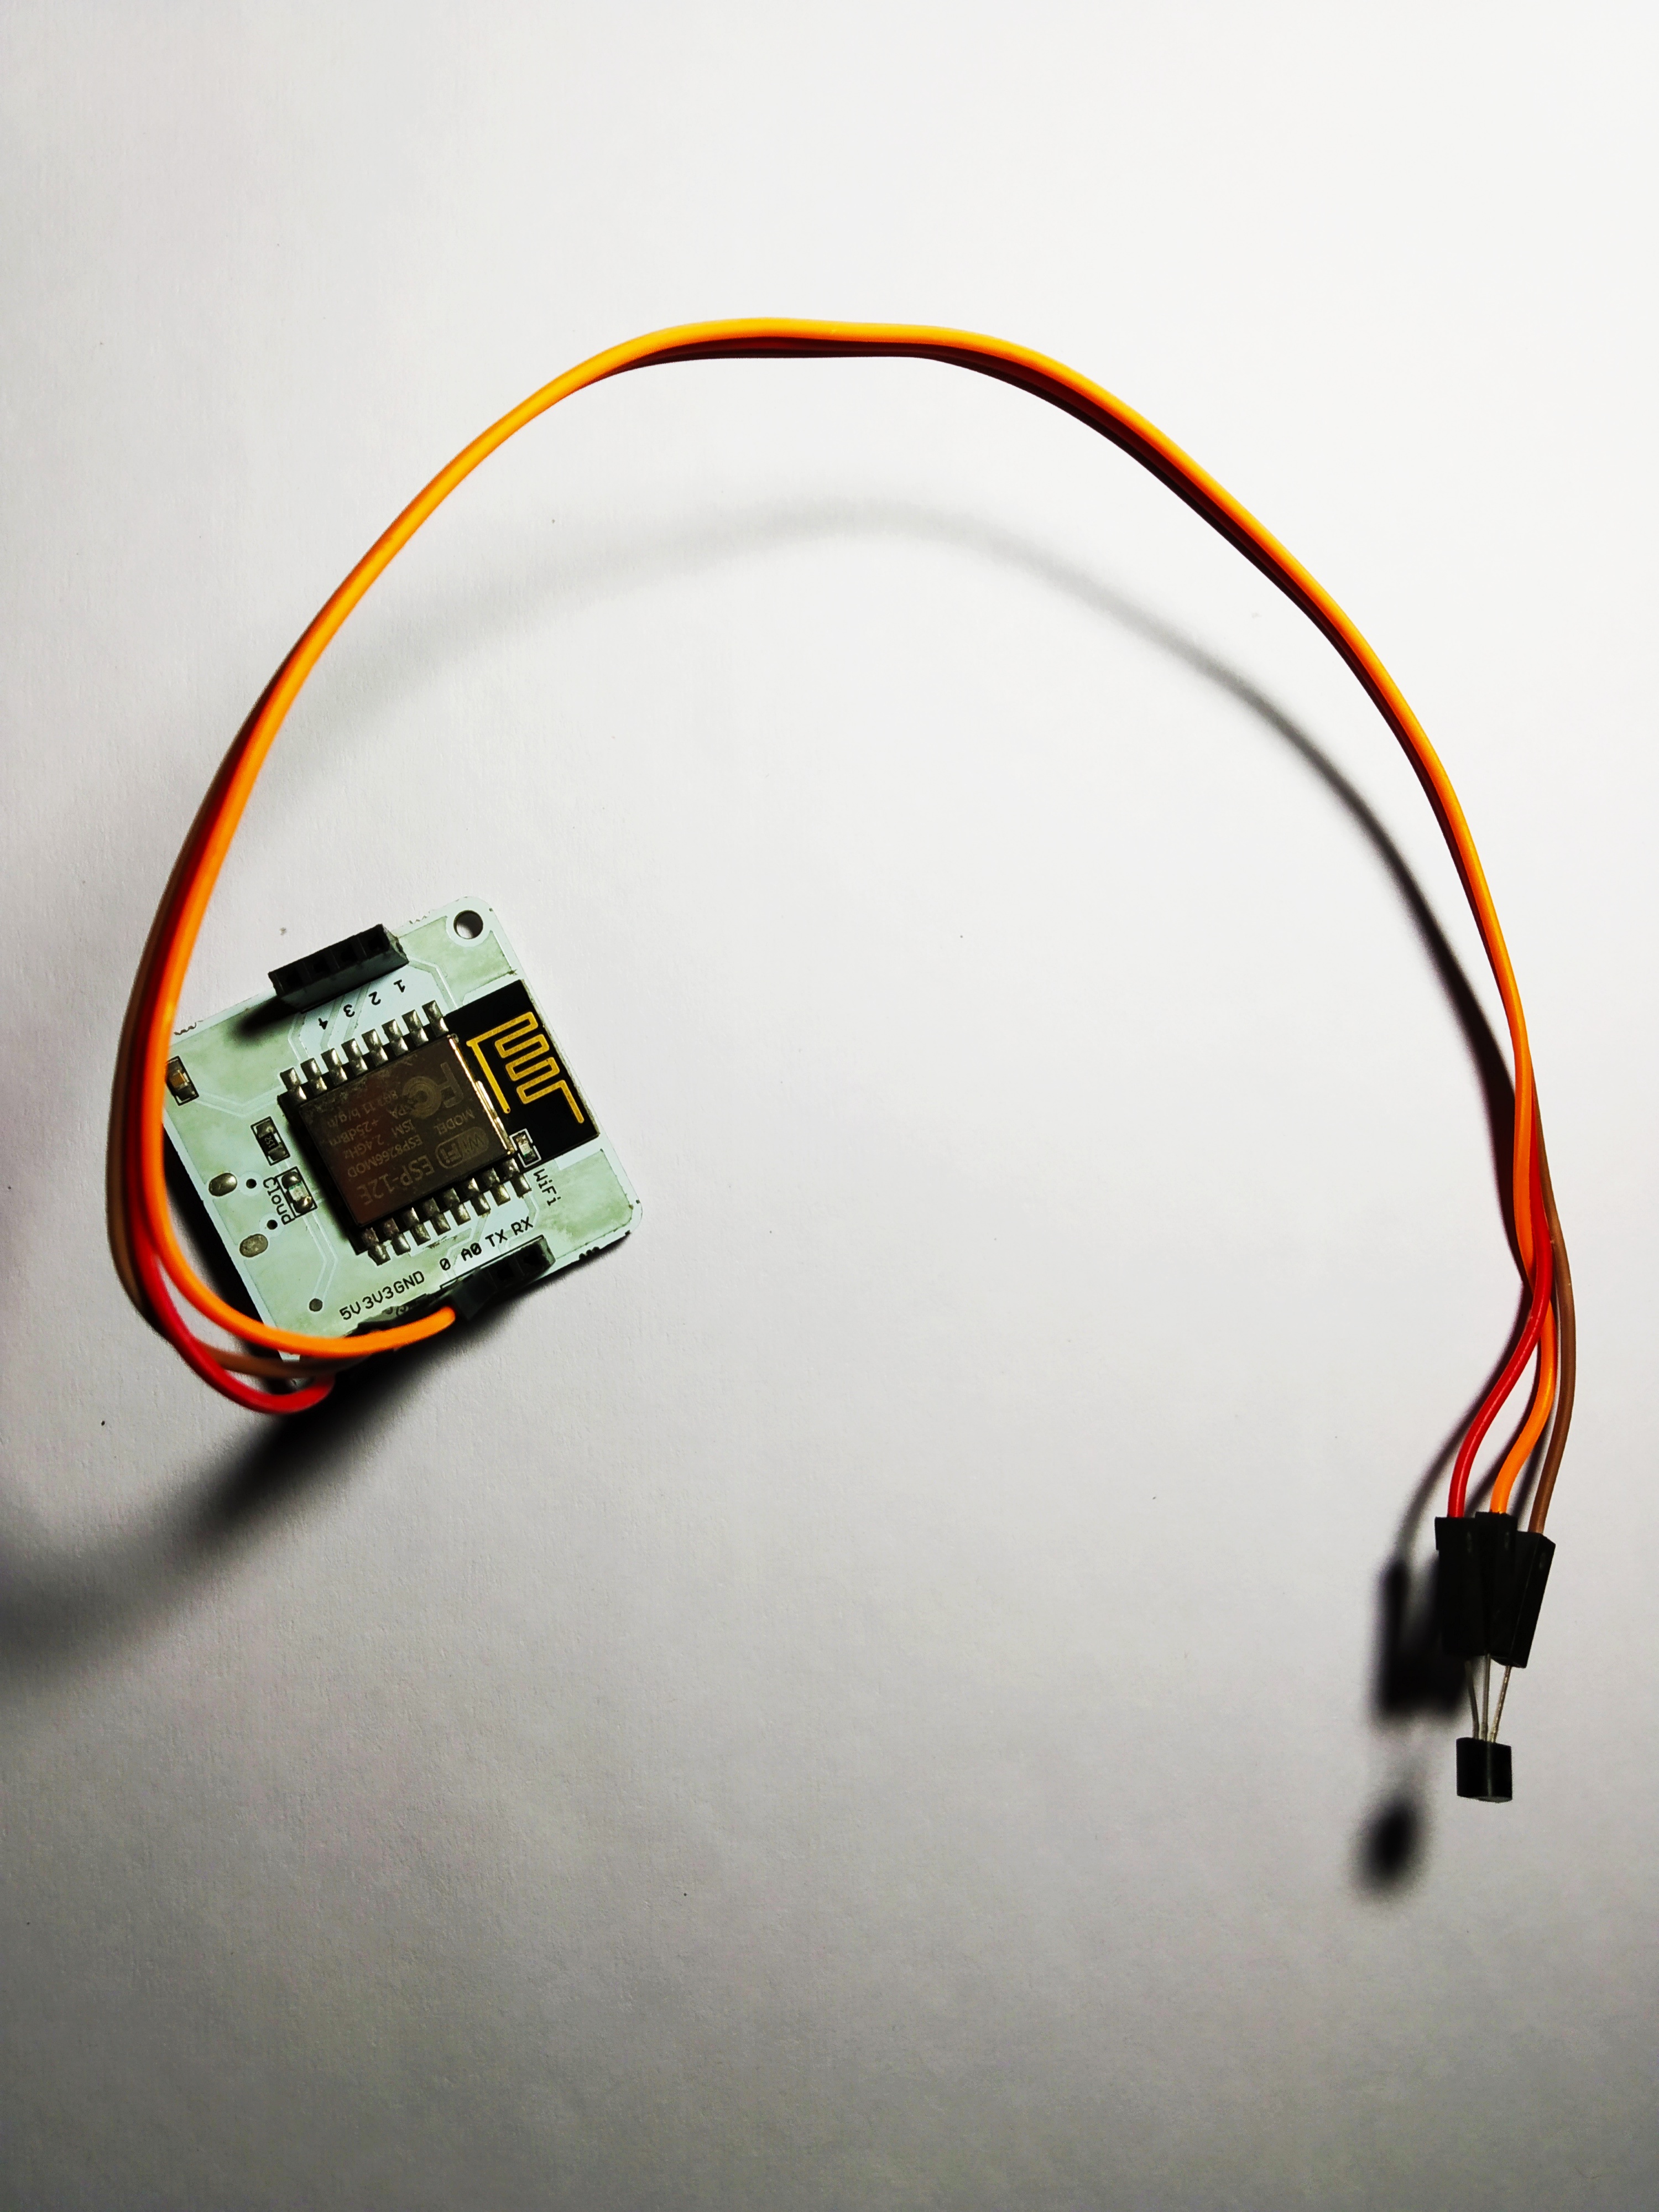
Objective A: Build the circuit for temperature monitoring system, using the Bolt and LM35 sensor
a. The Bolt WiFi module
b. 3 female to male wire
c. Temperature Sensor : LM35 sensor
Connecting the LM35 sensor to the Bolt :-
Step 1 : Hold the sensor in a manner such that we can read LM35 written on
it.
Step 2 : In this position, identify the pins of the sensor as VCC, output and
Gnd from left to right.
a. VCC is connected to the red wire.
b. Output is connected to the orange wire.
c. Gnd is connected to the brown wire.
Step 3 : Using male to female wire connect the 3 pins of the LM35 to the
Bolt Wifi Module as follows :
a. VCC pin of the LM35 connect to 5v of the Bolt WiFi module.
b. Output pin of the LM35 connects to A0 (Analog input pin) of the Bolt
WiFi module.
c. Gnd pin of the LM35 connects to the Gnd.
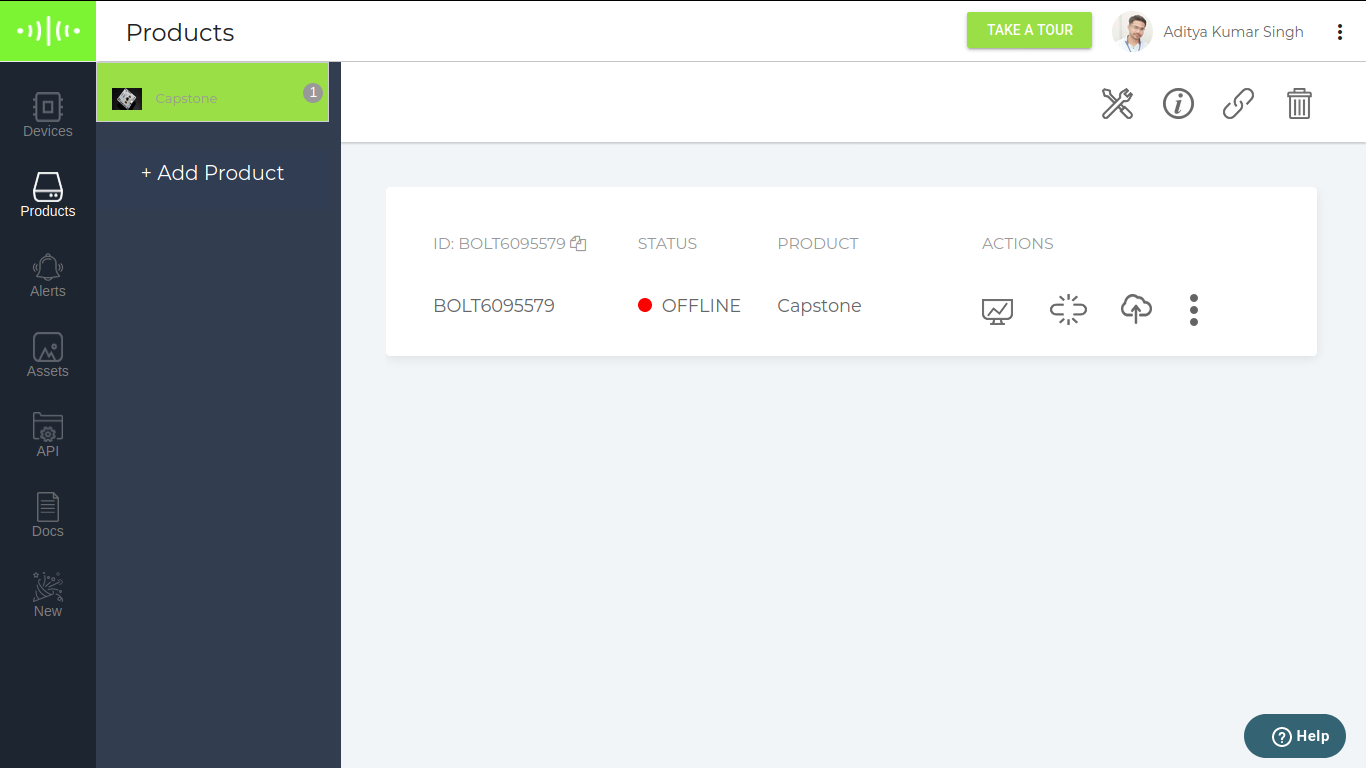
Objective B: Create a product on the Bolt Cloud, to monitor the data from the LM35
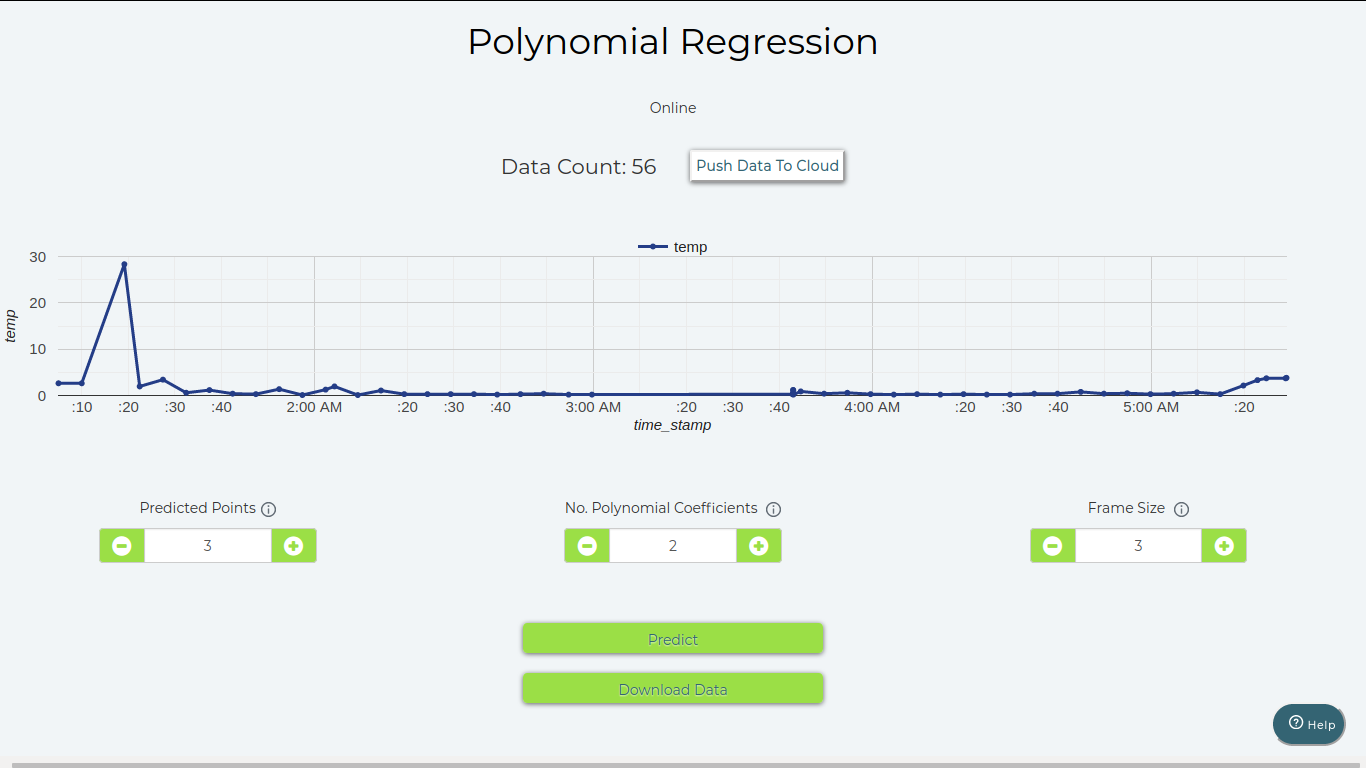
Understanding Polynomial Regreession
A. Prediction points: This number tells the Visualizer how many future data points need to be predicted. By default, the Visualizer spaces the points with the data collection time in the hardware configuration of the product. So if you set the product to collect data every 5 minutes, and select 6 prediction points, the Visualizer will predict the trend and show 6 points up to 30 minutes into the future.
B. No. Polynomial coefficients: Polynomial Visualizer processes the given input time-dependent data, and outputs the coefficients of the function of the form image below which most closely resembles the trend in the input data. This number tells the Visualizer how many elements should be present in the function i.e. the value of n.
C. Frame Size: These are the number of previous data points the Visualizer will use to predict the trend of the data. For example, if we set this value to 5, the Visualizer will use the previous 5 points to predict the trend.
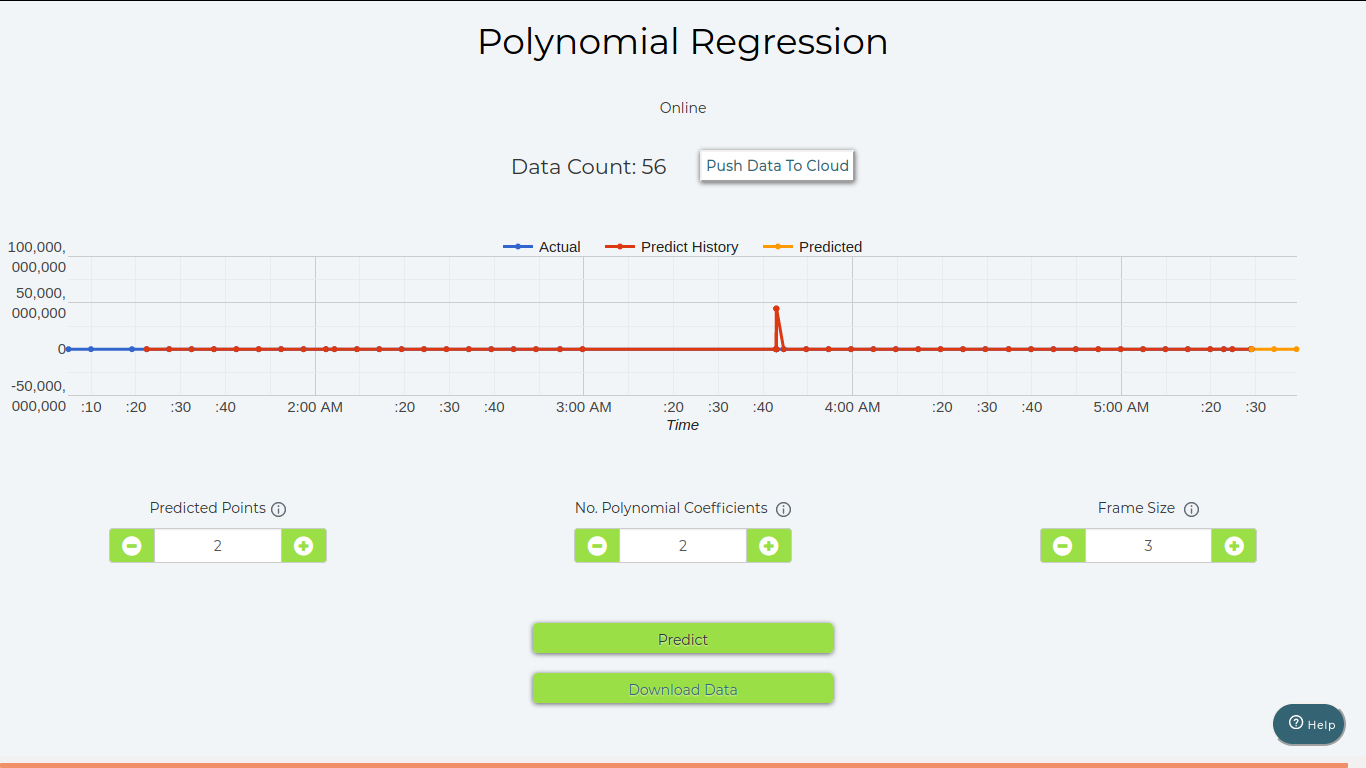
When we click on the predict button 2 graphs other than the data graph shown. These graphs are the prediction history, and the predicted data.
The prediction history graph helps us tune the machine learning model. We have to change the parameters below, to make it so that this graph most closely resembles the actual data. When this happens the predicted data, or the predicted future temperature will be most accurate.

Objective C: Write the product code, required to run the polynomial regression algorithm
setChartLibrary('google-chart');
setChartTitle('Polynomial Regression');
setChartType('predictionGraph');
setAxisName('time_stamp','temp');
mul(0.0977);
plotChart('time_stamp','temp');
The image of collected data is below.
Objective D: Record the temperature readings for about 2 hours.

Understanding Email Alert System
Step 1: Connect the temperature monitoring circuit as we have done in the previous lesson -Hardware connections for temperature monitor.
Step 2: Login into the server by entering the IP address of your digital ocean droplet.
Step 3: After successful login, create a file named email_conf.py which will store all the credentials related to Mailgun. To create a new file type sudo nano email_conf.py in the terminal. After that write below code to save all the credentials in a single file.
MAILGUN_API_KEY = '***********'
SANDBOX_URL= '************'
SENDER_EMAIL = '************'
RECIPIENT_EMAIL = '***********'
API_KEY = '*************'
DEVICE_ID = '************'
Note: We have to replace all the above value with your credentials. We can find the first four value in Mailgun dashboard and the last two in Bolt Cloud dashboard.
We store all the credentials in a separate file since it is sensitive data which should not be shared with anyone. Hence it is a good practice to avoid using credentials in code directly. After replacing all the values, save the file using CTRL+X.
Step 4: Now create one more file named temp_email.py. To do so we have to type sudo nano temp_email.py in the terminal. Now we will write main code to collect the data from the Bolt and send Email if it crosses the threshold.
Algorithm :-
1. Fetch the latest sensor value from the Bolt device.
2. Check if the sensor value is in the range specified in our min and max values.
3. If it is not in range, send the Email.
4. Wait for 10 seconds.
5. Repeat from step 1.
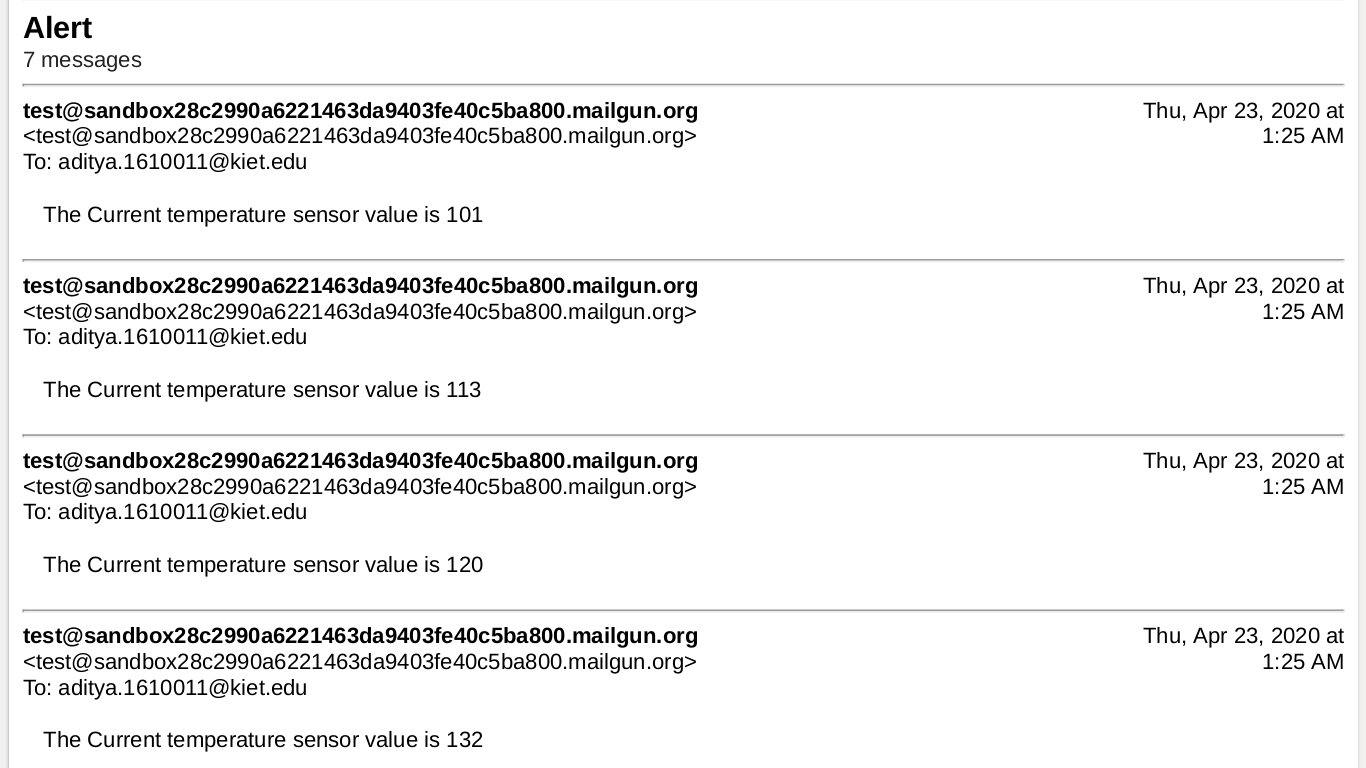
Image of Email Alert send by Mailgun is below :
Objective H: Understanding Z- scrore analysis and detection of anomaly.
Step 1 : Make the circuit connection for Temperature Monitoring .
Step 2: Once you are done with that, log in to your digitalOcean droplet and create a new folder to hold the files for this topic.
Step 3 : Make Directory for the analysis.
mkdir Anomaly_Detection
cd Anomaly_Detection
Step 4 :
nano conf.py
API_KEY = ' ********** '
DEVICE_ID = ' ********* '
FRAME_SIZE = 10
MUL_FACTOR = 6
Note : We can find the DEVICE_ID and API_KEY in Bolt Cloud Dashboard.
We can set the FRAME_SIZE to 10, and the MUL_FACTOR to 3 for now. Once done, we can save the configurations file by pressing 'CTRL+x' .
Step 5: Now create one more file named anomaly_detection.py, using the following command
sudo nano anomaly_detection.py
This file will contain the main code. The algorithm for the code can be broken down into the following steps:
1. Fetch the latest sensor value from the Bolt device.
2. Store the sensor value in a list, that will be used for computing z-score.
3. Compute the z-score and upper and lower threshold bounds for normal and anomalous readings.
4. Check if the sensor reading is within the range for normal readings.
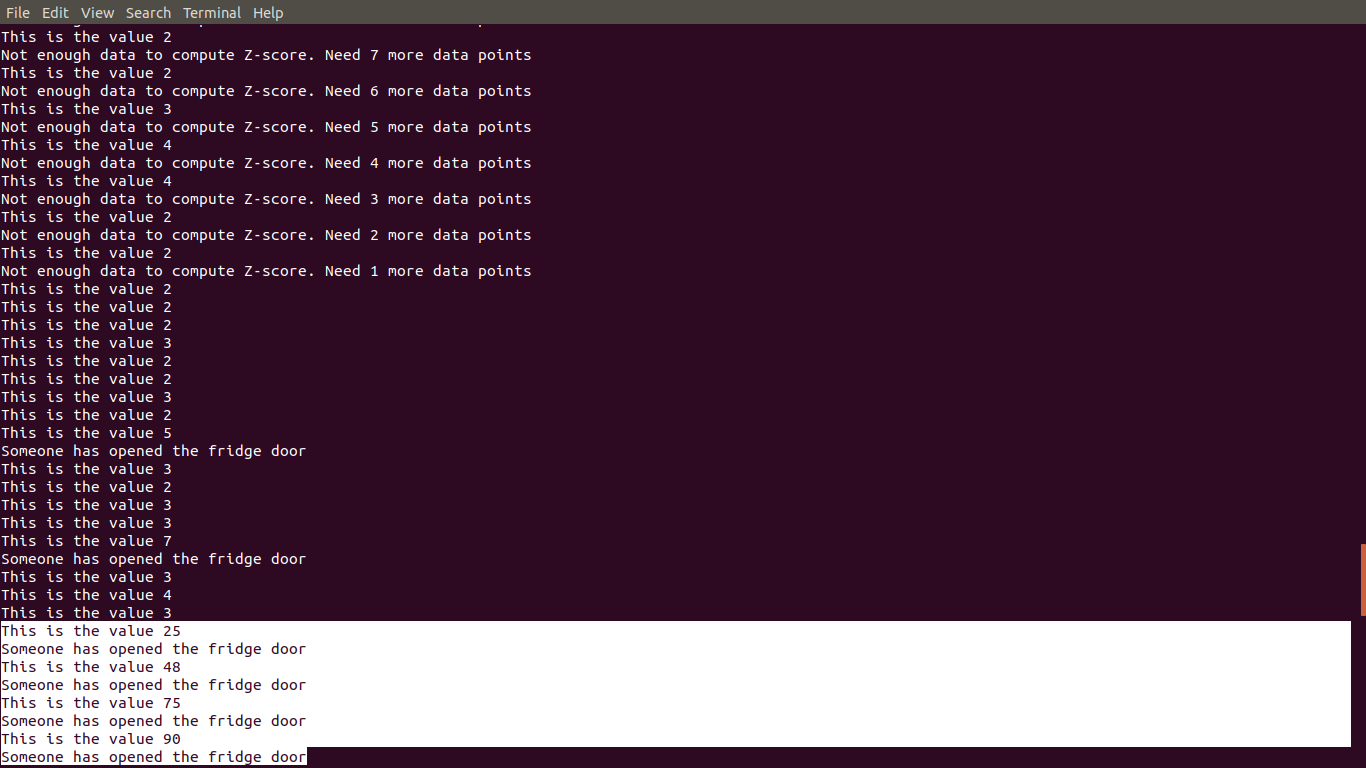
5. If it is not in range, print the line “Someone has opened the fridge door”.
6. Wait for 10 seconds.
7. Repeat from step 1.
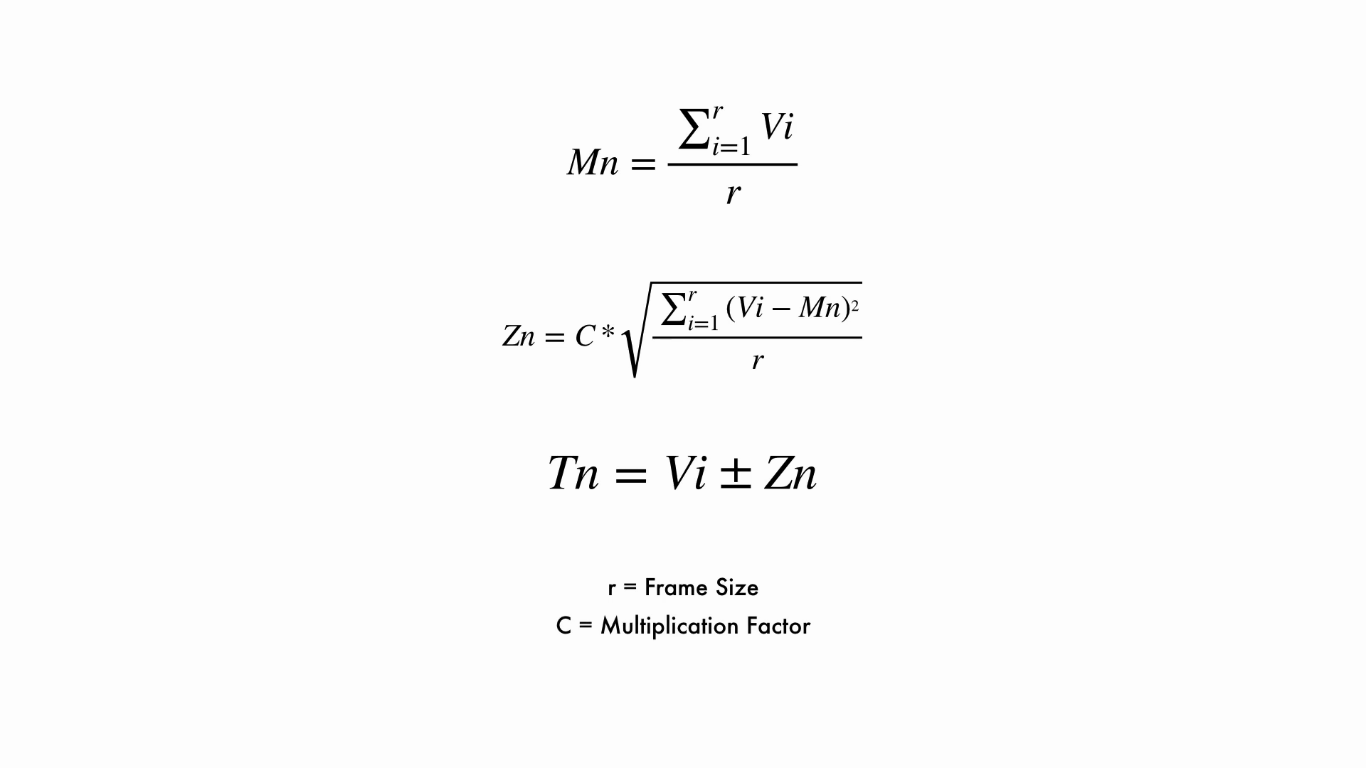
The important parameters used in Z-score analysis such as Mn, Zn and Tn are given below :


Comments