


Hardware components | ||||||
 |
| × | 1 | |||
 |
| × | 1 | |||
 |
| × | 1 | |||
Software apps and online services | ||||||
| ||||||
 |
| |||||
Hand tools and fabrication machines | ||||||
| ||||||
Post-Harvest Coffee Processing
We are addressing the problem of inconsistent coffee quality and post-harvest losses due to the lack of affordable, context-appropriate technology for monitoring and controlling fermentation and drying processes—critical steps in coffee production that are highly sensitive to micro-climate conditions.
Globally, over 125 million people depend on coffee for their livelihoods, with the majority being smallholder farmers in low-income, climate-vulnerable regions. These communities face increasing climate variability, yet have limited access to tools that help them adapt. Post-harvest processes—especially fermentation and drying—require precise control of temperature, humidity, and time. Without real-time data, farmers rely on guesswork, resulting in under- or over-fermentation, mold growth, or uneven drying, which lead to spoilage rates of up to 20% and downgraded quality.
In Indonesia, where we are currently working, smallholder farmers produce over 90% of the country’s coffee, yet many operate without standardized post-harvest practices or equipment. This contributes to inconsistent bean quality, price volatility, and limited market access, further exacerbating economic vulnerability.
Our solution targets these issues by enabling real-time monitoring of key variables during post-harvest processing using low-cost IoT sensors and a cloud-based platform. By equipping farmers with data-driven tools, we aim to reduce waste, improve quality, and build climate resilience.
Globally, with climate change expected to reduce coffee-suitable land by up to 50% by 2050, improving post-harvest efficiency and quality is essential to sustaining livelihoods and meeting growing demand. Our solution addresses both local and systemic drivers of post-harvest inefficiencies, positioning smallholder farmers to better adapt to a changing climate and participate in a more sustainable, low-carbon food system.Our solution deploys low-cost IoT sensors and a cloud-based platform to enable real-time monitoring of fermentation and drying processes. This empowers farmers with data-driven tools to improve quality, reduce waste, and adapt to changing climate conditions.
As climate change threatens to reduce coffee-suitable land by up to 50% by 2050, improving post-harvest efficiency is essential to sustaining livelihoods and ensuring a more climate-resilient, low-carbon food system.
Project DesignThe DHT22 is a low-cost digital temperature and humidity sensor that offers reliable performance and good accuracy. It is suitable for environmental monitoring due to its low power consumption and ease of interfacing with microcontrollers.
- Temperature Range: -40 to +80°C
- Humidity Range: 0–100% RH
- Accuracy: ±0.5°C (temperature), ±2% RH (humidity)
- Interface: Single-wire digital signal
The DFRobot pH sensor is designed to measure the acidity or alkalinity of a solution. It is based on an analog signal and is often used in water quality applications, including aquaponics, hydroponics, and environmental research.
- pH Range: 0–14
- Signal Type: Analog voltage
- Accuracy: ±0.1 pH (with calibration)
- Interface: Analog input (ADC)
The ESP32 is a powerful, Wi-Fi and Bluetooth-enabled microcontroller widely used in IoT applications. It features dual-core processing, multiple I/O options, and excellent compatibility with a wide array of sensors and peripherals.
- Processor: Dual-core Tensilica LX6
- Connectivity: Wi-Fi, BLE
- ADC Channels: Up to 18 (12-bit resolution)
- UART/SPI/I2C support for sensor interfacing
In this system, the ESP32 reads analog and digital data from the sensors, processes the information, and sends it via serial communication to the nRF54L15 DK for further use.
The nRF54L15 is part of Nordic Semiconductor's next-generation ultra-low-power wireless SoCs, designed for advanced IoT use cases. It is ideal for Bluetooth Low Energy (BLE) and other wireless communication tasks, making it suitable for real-time environmental data sharing.
- Core: ARM Cortex-M33
- Wireless Support: BLE, Thread, Zigbee
- Advanced Peripherals: SPI, I2C, UART, GPIO, PWM
- Ultra-low power consumption
In this project, the nRF54L15 DK receives sensor data from the ESP32 and is responsible for local display, logging, or wireless data transmission to a cloud server or dashboard.
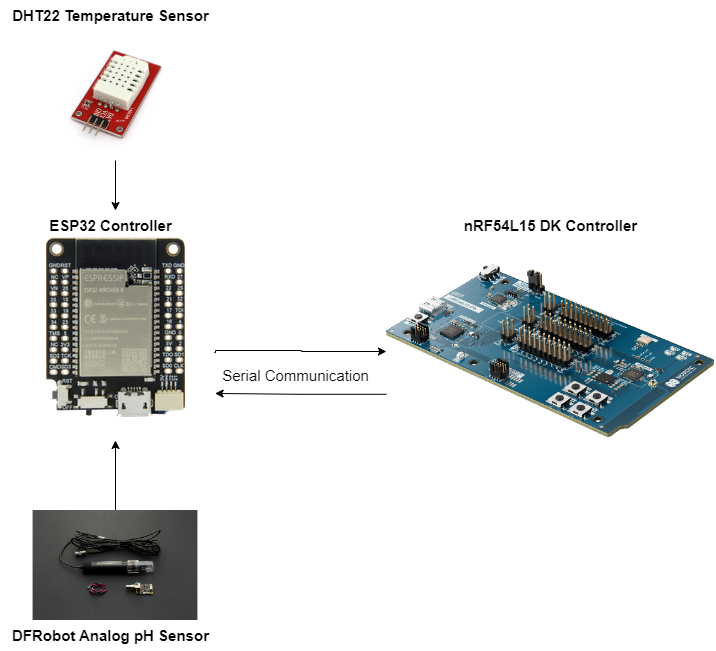
This system diagram illustrates the integration of environmental sensors with microcontroller platforms for real-time monitoring: the DHT22 Temperature Sensor and DFRobot Analog pH Sensor are connected to an ESP32 Controller, which processes the sensor data and communicates it via serial communication to the nRF54L15 DK Controller for further processing or wireless transmission.
The system consists of three key sensing components and two microcontroller units:
- DHT22 Temperature Sensor: Measures ambient temperature and humidity.
- DFRobot Analog pH Sensor: Measures the pH level of water or other liquid solutions.
- ESP32 Controller: Serves as the data acquisition unit.
- nRF54L15 DK Controller: Acts as the central communication and control unit.
- Serial Communication Interface: Used for data transmission between the ESP32 and nRF54L15 DK.
The entire system is designed to monitor environmental conditions in real-time and communicate the results wirelessly using the advanced features of the Nordic Semiconductor nRF54L15 DK platform.
The system works in the following steps:
Step 1: Data Acquisition via ESP32The DHT22 sensor is connected to a digital input pin on the ESP32 and periodically sends temperature and humidity data. The pH sensor is connected to one of the ESP32’s ADC pins to measure the analog voltage corresponding to the pH level. The ESP32 processes and formats this sensor data, converting raw values into readable units such as °C and pH.
Step 2: Serial CommunicationOnce the ESP32 gathers and formats the sensor data, it transmits the data using UART serial communication to the nRF54L15 DK. Data packets are structured with identifiers (e.g., "TEMP:25.5;PH:7.3") for easy parsing at the receiver end.
Step 3: Data Handling by nRF54L15 DKThe nRF54L15 DK receives the serial data and parses it. Depending on the application, this data can be: Displayed on an LCD or OLED screen Stored locally on SD or EEPROM Transmitted via BLE to a smartphone or central hub Uploaded to the cloud for remote monitoring using an MQTT broker or REST API.
Step 4: Communication Protocols- UART Serial Communication
- Baud rate typically set at 9600 or 115200 bps
- Used for reliable, low-latency communication between the ESP32 and the nRF54L15 DK
- BLE (Bluetooth Low Energy) The nRF54L15 DK can be configured as a BLE peripheral to broadcast sensor readings.
- Mobile apps or other BLE-enabled devices can subscribe to this data for visualization or alerts.
It collects, controls, and monitors temperature, time, and pH (acidity level) during the fermentation process to reduce the risk of sour or off flavors, bacterial growth, and insect invasion. This early fermentation stage plays a crucial role in defining the characteristic acidity and clarity of washed coffees. The hardware design features a networked sensor system consisting of an ESP32 microcontroller (MCU) with built-in Wi-Fi for internet connectivity, and an nRF54L15 DK board functioning as the IoT edge device. The system is programmed using the visual studio code on a computer and utilizes low-cost sensor modules to measure pH and temperature throughout the fermentation process.
nRF54L15-DK Programming Setup- Open Toolchain Manager
- Install nRF Connect SDK
- Open nRF Connect at VS Code
- nRF54L15 Testing for Debug in nRF Connect
- Build program nRF54L15 DK in VS Code
- Serial Interfacing of nRF54L15-DK with ESP32 as Sensor Node
Data acquisitionof Fermentation Process
In this experiment, coffee beans were stored in the refrigerator for approximately 2 months. Then the coffee bean samples were tested in an open loop fermentation temperature control process. Fermentation temperature control can be done by providing several treatments, including: Peltier temperature can be controlled in the cooling and heating process in fermentaton.
It shows a laboratory test setup for monitoring the coffee fermentation process using an IoT-based system.
Fermentation Container (center): A small bowl filled with coffee cherries or beans submerged in liquid, simulating the fermentation stage. A blue pH probe is inserted into the mixture to monitor acidity levels, which are crucial for quality control during fermentation. Sensor System (bottom left): A breadboard-based prototype featuring:
- An ESP32 microcontroller for data processing and Wi-Fi connectivity.
- A DFRobot analog pH sensor module connected to the probe.
Multiple jumper wires and power connections for different sensors (temperature, pH, etc.). White Heating Plate (beneath the bowl): Likely used to maintain or simulate fermentation temperature. Power Supply Module (top right): Supplies regulated voltage and current to the entire system, including the sensors and controllers. Additional Electronics (middle right): Possibly a DC-DC converter or motor driver, used to regulate voltage or power cooling components.
This figure is the data from the fermentation temperature control process experiment for almost 46 hours. This experiment aims to determine the change in pH rate with various temperature variations in the fermentation medium.After measuring the acidity level, the coffee beans that had been stored for 2 months in the refrigerator did not experience acid formation. However, the pH value can only change when the temperature is controlled. The blue graph is the controlled temperature, while the green graph is the ambient temperature. The temperature is controlled below the ambient temperature which is the fermentation cooling process, while the temperature controlled above the ambient temperature is the heating process. From 0 to 200 minutes it is controlled at a temperature below 20 ° C which causes a decrease in pH from 7.4 to 7.2.Then the next process is temperature control at a temperature close to the ambient temperature for approximately 6.6 hours, so that the pH change does not appear to have decreased significantly.The next process is temperature control which is carried out in 2 cooling processes and 2 heating processes. From the graph shows that the controlled cooling process at a temperature of 20 °C causes an increase in pH, while the controlled heating process at a temperature of 50 °C can cause a decrease in pH. Based on the histogram data above, the distribution of control temperature (15 < T < 30) ° C, temperature control at ambient temperature and below ambient temperature, contributes to pH changes in the range of 7 to 7.2. While the distribution of control temperature (40 < T < 60) ° C, the fermentation heating process, contributes to pH changes in the range of 6.6 to 7.By simplifying data access through a mobile dashboard with visual alerts and multilingual, low-literacy-friendly interfaces, we ensure that anyone—regardless of age, literacy level, or physical ability—can monitor and manage the coffee fermentation and drying process effectively.
The system empowers users to standardize their post-harvest practices, improving quality and reducing guesswork. Once consistency is achieved, farmers—especially women and marginalized groups—can identify which stages of processing can be optimized for efficiency or diversified into value-added products. This flexibility enables them to better adapt to shifting market demands.
By reducing barriers to entry and supporting inclusive skill-building, we help ensure that all members of the community can participate in and benefit from a more sustainable, climate-resilient coffee economy. Ultimately, this contributes to stronger economic resilience, greater independence, and long-term sustainability across generations and abilities.


Comments