


Hardware components | ||||||
_ztBMuBhMHo.jpg?auto=compress%2Cformat&w=48&h=48&fit=fill&bg=ffffff) |
| × | 1 | |||
 |
| × | 1 | |||
 |
| × | 1 | |||
Software apps and online services | ||||||
 |
| |||||
| ||||||
Decided to do this DIY project, inspired by the ultrasound radar which I saw.
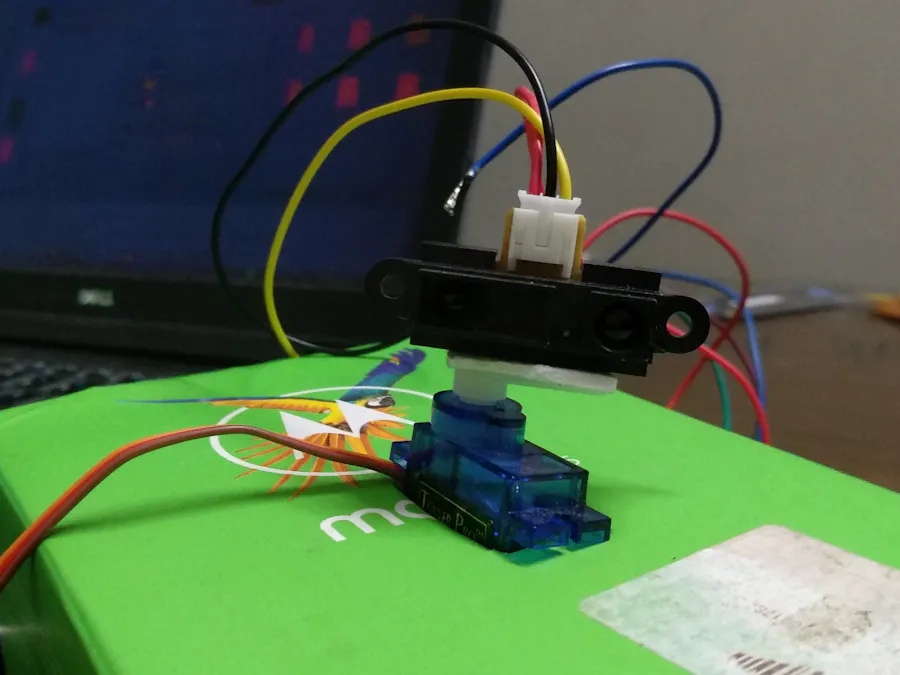
I had tried using the HC-05 ultrasound sensor at first, but its not great when anomalies in the contours occur like corners of a box etc. So, I turned to the infrared proximity sensor which didn't have as much range but was a lot less confused when it encountered corners in the contour
Step One: Components AssembleThe circuit is fairly simple just assemble it according to the schematic
And while you are at it, you can double side tape the ir sensor to the servo's
And put it in some sort of enclosure
Upload the arduino code onto the board, however dont disconnect the board when you are done. The mapper works by interfacing with the computer remember?
#include <Servo.h>
#include <Wire.h>
#define sensor A1 // Sharp IR
#define max_angle 180 //depends what angle it is rotating
Servo s;
int pos=0;
void setup() {
 Serial.begin(9600); // start the serial port
 s.attach(7);
}
void loop() {
 // 5v
 if(pos>=max_angle)
 {  pos=0;
     s.write(pos);
     delay(1000);
 }
 s.write(pos);
 float volts = analogRead(sensor)*float(5)/1024;  // value from sensor * (5/1024)
 float distance = 25.95*pow(volts, -1); // worked out from datasheet graph
 delay(50); // slow down serial port
 pos+=1;
 Serial.println(distance);
}
Run the python code,
If you are using windows or Mac you should check the 'COM' number and replace it in this section of the code. (replace '/dev/ttyACM' with COM)
This was written on my linux using laptop hence the weird looking port number
ser = serial.Serial('/dev/ttyACM'+str(scan),baudrate='9600')
Here is the full code
import numpy as np
import matplotlib.pyplot as plt
import serial
#angle of servo sweep
N=180
#connect to serial port
scan = 0
r=[]
while scan<100:
       try:
           ser = serial.Serial('/dev/ttyACM'+str(scan),baudrate='9600')
           if ser.isOpen():
               print('Connected to'+'/dev/ttyACM'+str(scan))
               break
       except:
           print("access error")
           scan+=1
#taking multiple readings of the sensor
for i in range(N):
   s=ser.readline(100)
   print(i,float(s))
   r.append(float(s))
print(r)
#setting theta values
theta = [np.pi/180*i for i in range(1,(N)+1)]
colors = r
#plotting the graph
fig = plt.figure()
ax = fig.add_subplot(111,projection='polar')
c = ax.plot(theta, r)
plt.show()
You can put this in a shoe box or some enclosure of definite shape and then try testing
You should see a roughly box shaped outline
Here is one for a large saucepan like vessel which I put it in, shortly before cooking it and making my servö deˊ idiöt.


Comments
Please log in or sign up to comment.