


Hardware components | ||||||
 |
| × | 1 | |||
 |
| × | 1 | |||
 |
| × | 1 | |||
 |
| × | 1 | |||
Software apps and online services | ||||||
 |
| |||||
Hand tools and fabrication machines | ||||||
 |
| |||||
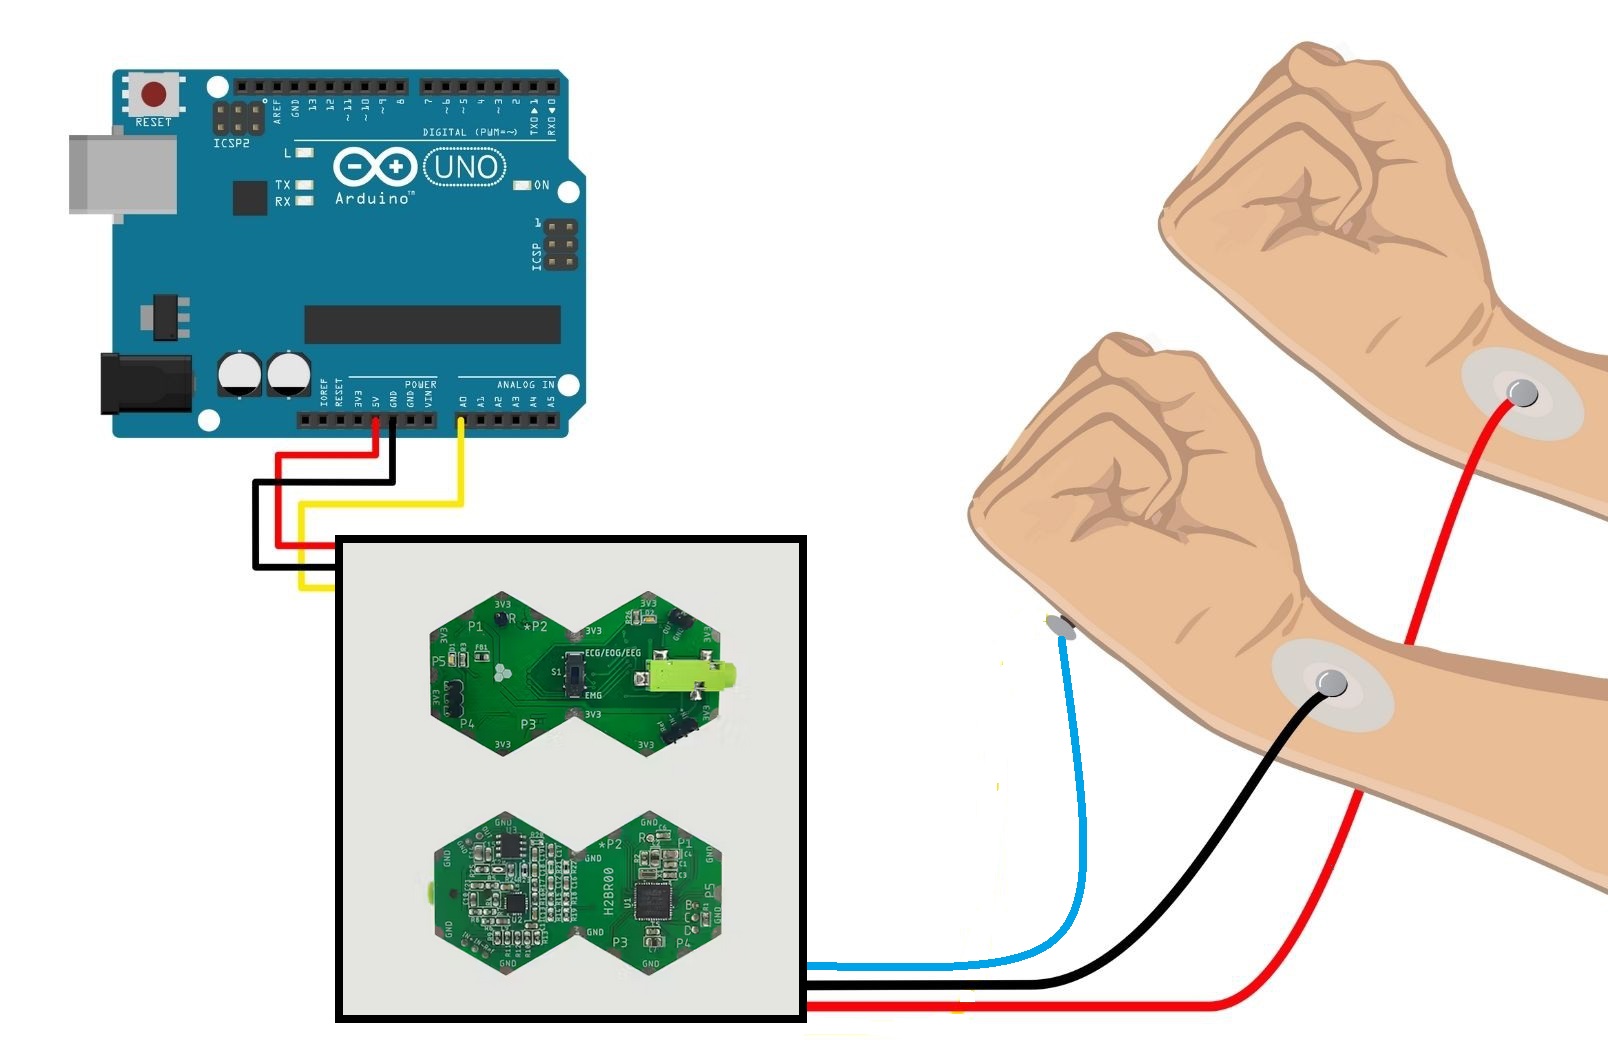
In this project, we will use an Arduino board in conjunction with the Hexabitz Single-Lead EXG Monitor Module (H2BR0) to plot analog signals on a plotter for visualizing biosignals such as ECG (Electrocardiogram) and EMG (Electromyogram).
- Arduino Uno
- Connecting cables
- Electrode pads
- Computer with Arduino IDE installed
- Single-Lead, EXG Monitor (H2BR0x):
Hexabitz Single-Lead, EXG Monitor Module (H2BR0) is one of a kind module that can record publication-grade biopotential signals from your body be it from the heart (ECG), brain (EEG), eyes (EOG), and muscles (EMG).
What makes it different?
- Record publication-quality biopotential signals like ECG, EMG, EOG, or EEG.
- Small size allows easy integration into mobile and space-constrained projects.
- H2BR0 is based on STM32G0 MCU.
- Program advanced C code with our easy-to-use APIs.
- You can connect to external hardware or combine with other Hexabitz modules!
Setup the Hardware:
- Connect the Hexabitz EXG Monitor Module to the Arduino Uno (A0- GND) using the provided connecting cables.
- Attach the electrode pads to the subject's body as per the instructions provided with the Hexabitz module.
- Ensure all connections are secure and the module is properly powered.
Programming the Arduino:
- Open the Arduino IDE on your computer.
- Write or upload the code to read the analog signals from the Hexabitz module and send the data to the serial plotter.
Visualizing the Data:
- Once the code is uploaded, open the serial plotter in the Arduino IDE.
- Observe the real-time plotting of the biosignals on the plotter.
- Adjust the settings and parameters as needed to get a clear and accurate visualization of the signals.
int y;
int x = 0;

void setup() {
  // initialize the serial communication
  Serial.begin(921600);
 }

void loop() {
  y = analogRead(A0);  // Analog output of ExG
  Serial.println(y);  // Send the analog value to the serial plotter

  if (x == 300) {
    x = 0;
    Serial.println("C");
  }
  x++;
  delay(30);
}
Here's the explanation for the code:
1. Variables:
- `int y;` declares a variable `y` to store the analog value read from the ExG monitor.
- `int x = 0;` initializes a counter variable `x` to 0.
2. Setup Function:
- `Serial.begin(921600);` initializes the serial communication at a baud rate of 921600. This allows the Arduino to send data to the computer.
3. Loop Function:
- `y = analogRead(A0);` reads the analog value from pin A0, which is connected to the ExG monitor, and stores it in the variable `y`.
- `Serial.println(y);` sends the analog value `y` to the serial plotter for visualization.
4. Counter Logic:
- `if (x == 300) {... }` checks if the counter `x` has reached 300.
- If true, it resets `x` to 0 and prints "C" to the serial plotter.
- `x++;` increments the counter `x` by 1.
- `delay(30);` introduces a delay of 30 milliseconds to prevent overwhelming the serial communication.
The code continuously reads the analog value from the ExG monitor and sends it to the serial plotter for real-time visualization. The counter and delay help manage the data flow and ensure smooth plotting.
By following these steps, you can successfully integrate the Hexabitz Single-Lead EXG Monitor Module with an Arduino to visualize biosignals. This setup can be used for various applications, including health monitoring and research projects.


Comments