The Midnight Databoy
IntroductionLogging telemetry from Internet of Things (IoT) sensors is a saturated rites of passage exercise after the obligatory Hello World exercise is complete. This note examines a simple scheme to log sensor readings but adds a twist to illustrate the use of distributed Raspberry Pi servers and Elegoo Arduino controllers in a Home Automation intranet.
Telemetry
Once the sensors are pumping out data the logical question is how to serve this data for downstream processing. The traditional routes are:
· Just display it
· Save it on local storage media – hard disk or other external media
· Publish it for use by other apps in the farm
The first two methods have variations too.
Just display it
The display can be a scrolling list of tabular data or some graphical representation that matches the needs. For example, a basic line chart can be sufficient for barometric pressure. However, for wind speed and direction a rose diagram is more meaningful since it combines the persistence of wind direction with average wind speed in a simple polar plot.
Save it
The sensor is written to local storage media in a format to simplify subsequent processing:
· Comma separated values for import into spreadsheet or custom applications
· Javascript Object Notation(JSON) format for more efficient use by databases or applications
Publish it
This note examines two variations of this approach:
· Inserting the data into a relational database
· Publishing the data to a service broker for dissemination to subscribers
Where else one might ask? If not the cloud then where? The other overworked example in the publishing category is to send the data to a Cloud service provider’s site! While this approach is good for production use irrespective of the scale of the solution, the common human frailty is to forget to turn the “switch off” with test exercises thereby dissipating the trial period sooner rather than later.
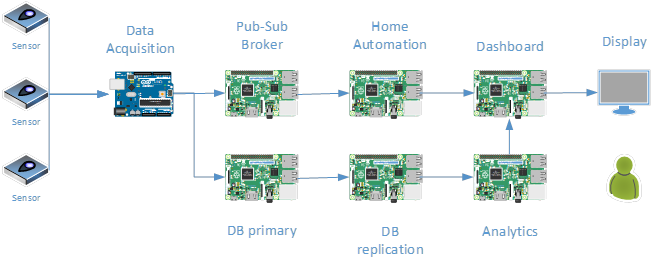
WorkflowThe diagram below illustrates the data flow from the sensor to the downstream servers. For this note the data flow is represented as uni-directional. The actual farm, of course, uses devices that receive data from a management server but including additional devices in the diagram is beyond the scope of this note.
There are multiple sensors feeding data to a data acquisition server. There are many data acquisition boards (some are Elegoo Arduino microcontrollers with serial or WiFi interfaces while others are Raspberry Pi Zero W boards) in the farm but illustrating a single server is sufficient to explain the concept in this note. Also, the number of discrete “servers” need for the demonstration can be reduced easily. Since the farm has been in operation for several years, it was more appropriate to illustrate the fact that the distribution of tasks enables each server to fulfill a dedicated role. In practice, some of these servers (e.g. DB replication) perform additional roles that are unrelated to this note’s main topic.
All the boards except for the Dashboard operate in headless mode. The roles of the symbols in the diagram are:
Board Description
Sensors Many devices distributed throughout the farm Air quality, compass, gases, humidity, infra-red, moisture, motion sensor, pressure, sound, switch, temperature, ultra-violet, vibration, water, wind
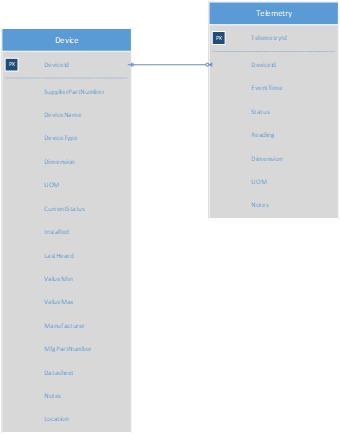
SchemataThe simple schemata for the operation are shown below with aparent child relationship between Device and Telemetry tables:
The schemata have many other auxiliary tables that support the operations of the farm but a description of these tables is not relevantfor this note.
Data AcquisitionAs mentioned in the preceding table, there are many, many sensors dispersed throughout the intranet. Most of the sensors have a single variable for measurement while a few capture multiple related variables such as pressure, temperature and humidity. Since the code to operate the sensors vary so widely it would be impractical to provide examples for each sensor enumerated in the table.
The data acquisition process has two basic approaches:
- Infinite loop
- Interrupt driven
Infinite loop
This mode is preferred for the microcontroller boards with flexible intervals to retrieve the data. The microcontroller code has a core loop function under which this operation is performed with the delay interval customized to the nature of the sensor device.
For situations where the Raspberry Pi Zero board acts as a nominal supervisory control and data acquisition system, the cron utility is leveraged to schedule the data retrieval. For some sensors (e.g. air-quality, gas and wind) the time interval is a minute while for others (e.g. soil moisture) it is muchlonger (i.e. hour).
Interrupt driven
There are some basic challenges in using the infinite loop method to obtain data from specific sensors. For example, it is more expedient to let the sensor inform the data acquisition board that it has new data to transmit. Also, using the delay function within an infinite loop does not necessarily free the allocated resources to other processes in the microcontroller.
The interrupt approach works efficiently for the motion sensor which notifies the data acquisition board (a la “don’t call us, we’ll call you”) to retrieve the data only when there is a change in its observation field. Furthermore, the motion sensor itself has some settings that can be customized for this purpose:
· Don’t trigger repeatedly; requires explicit reset signal
· Resume motion detection after an elapsed period
These settings improve the usability of the sensor but be warned precise control of the elapsed period requires calibration since the quality of the sensors vary between manufacturers and even manufacturing batches owing to the low cost of the motion sensors for hobbyist use.
The Azure Sphere board has superior functions to lever age this mode even for blinking LED lights!
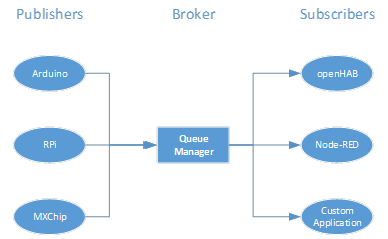
Pub-Sub BrokerThe publish-subscribe model in the farm centers around the MQTT protocol. It is a very lightweight messaging transport that is very popular in IoT solutions owing to its small footprint and minimized data packets that are efficiently distributed. A minimal MQTT control message can be as little as two bytes of data. The broker receives messages from publishers (the data acquisition boards) and releases these messages to subscribers in the farm as shown below.
There queue manager offers quality of service in three ways:
· Fire and forget –the publisher posts the message to the queue and it does not require any acknowledgement from the broker
· Acknowledged delivery– the publisher continues to post a message repeatedly until it receives and acknowledgement from the broker
· Assured delivery –the publisher posts a message and a subscriber acknowledges receipt
Publish
The following text box illustrates skeleton Python code fora publish operation that uses the mosquitto package to publish simple messages.
def MyPubSingle(topic,payload): # connect, publish a message to brokerand disconnect with default values primarily
  global hostname,qos, retain, port, client_id, keepalive, will, auth, tls, protocol,      transport
  publish.single(               #the parameters are static (for now!)
    topic, #string, to which the payload will be published
    payload,                    # if"" or None, zero length payload will be published
    qos, retain, hostname, port, client_id, keepalive, will, auth, tls, protocol,
    transport)
  return 0
The two key parameters are:
· Topic – a string representing the subject of the message for classification of the message queue
· Payload
Topic
The topic string in the current intranet farm conforms to the following tree structure with the forward slash character (/) acting as atopic level separator in a hierarchy:
HA/telemetry/<sensordimension>
Where examples of <sensor dimension> includebut not limited to:
· humidity
· pressure
· temperature
Wildcards
The hash character (#) acts a wildcard for topic strings. The Node-RED widgets use this property to subscribe to all telemetry messages as follows:
HA/telemetry/#
As a result all messages under the topic tree HA/telemetry are received without worrying about changes resulting from future publishers. There is a maintenance utility to remove unwanted topics by setting a value for the TREELIFE parameter (in the service broker). Also, best practices are observed and session (or sticky) data are never inserted in the topic string by the publishers.
Payload
The payload is synthesized as a JSON structure as shown below from a debug session at a subscriber client:
{"Status": 3, "DeviceId":"DS18B20-08-28", "Reading":77.7872, "UOM":"\u00b0F", "Waqt":"2019-05-29T17:51:12.161400", "Dimension":"Temperature"}
{"Waqt":"2019-05-29T17:51:12.893204", "Reading":34.78177711186752, "UOM":"\u00b0C", "Dimension":"Temperature", "Status":0, "DeviceId":"BME680-08-1"}
{"Waqt":"2019-05-29T17:51:12.893204", "Reading":974.2429958879013, "UOM":"hPa", "Dimension":"Pressure", "Status": 0,"DeviceId":"BME680-08-1"}
{"Waqt":"2019-05-29T17:51:12.893204", "Reading":31.206078188994084, "UOM":"%rH", "Dimension":"Humidity", "Status": 0,"DeviceId":"BME680-08-1"}
{"Waqt":"2019-05-29T17:51:12.893204", "Reading":1114504.3165641152, "UOM":"IAQ", "Dimension":"AirQuality", "Status":0, "DeviceId":"BME680-08-1"}
This structure facilitates data import by applications without the need for the development of custom interfaces.
Subscribe
The following text box illustrates reference code for a subscribe operation from the command line for all telemetry messages in the farm using minimal parameters:
mosquitto_sub -h <server name or localhost> -u <username> -P <password> “HA/telemetry/#”
The insertion of the telemetry data into a relational database is a routine operation. While most introductory examples revolve around thebasic SQL INSERT command for a single table, this note requires a two-step approach owing to the parent-child relationship illustrated in the schemata.
The flexibility afforded from this design also offers referential integrity. Any sensor can submit its payload to the database. However, if the device name does not exist in the parent table then a corresponding record is inserted in the parent table. The primary key from this INSERT command is passed to the child table where it is used as the foreign key during the second INSERT command. These steps are accomplished in a basic SQL stored procedure as shown below:
BEGIN
/* DECLARE EXIT HANDLER FOR SQL EXCEPTION; */
DECLARE l_DeviceId INT;/* device unique identifier */
START TRANSACTION; /*new transaction */
/* does named device exist in table */
SELECT DISTINCT DeviceId INTOl_DeviceId
FROM Device
WHERE DeviceName = p_DeviceName;
/* since device name does not exist, insert & obtain identifier */
IF ISNULL(l_DeviceId) THEN
INSERT INTO Device
(DeviceName,DIMENSION, UOM, CurrentStatus)
VALUES (p_DeviceName, p_Dimension, p_UOM,p_Status);
/* retain the auto incremented unique id for statu supdate later */
SET l_DeviceId = LAST_INSERT_ID();
 END IF;
/* update telemetry table with supplied values & link to parent table */
INSERT INTO Telemetry
(DeviceId,STATUS, Reading, DIMENSION, UOM)
VALUES (l_DeviceId, p_Status, p_Reading, p_Dimension,p_UOM);
/* update device status */
UPDATE Device SET LastHeard= CURRENT_TIMESTAMP, CurrentStatus = p_Status
WHERE DeviceId = l_DeviceId;
COMMIT; /* makechanges permanent */
END;
This topic is covered in a separate note.
Analytics RThe farm uses near real-time analytics to process time-series data from the sensors. There are several scripts in R for thispurpose. These scripts will be examined in a future note.
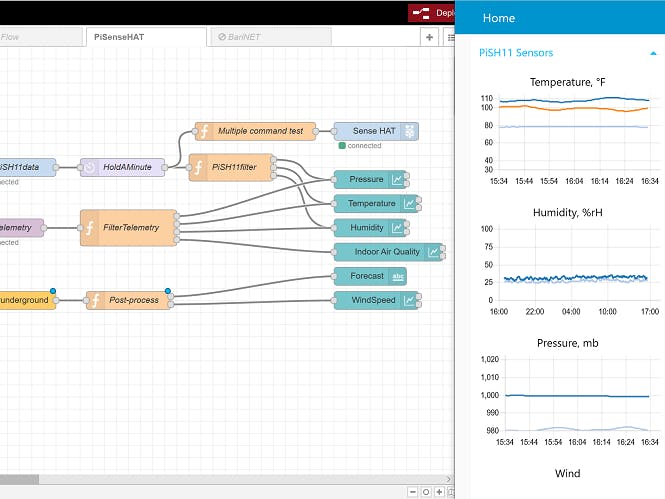
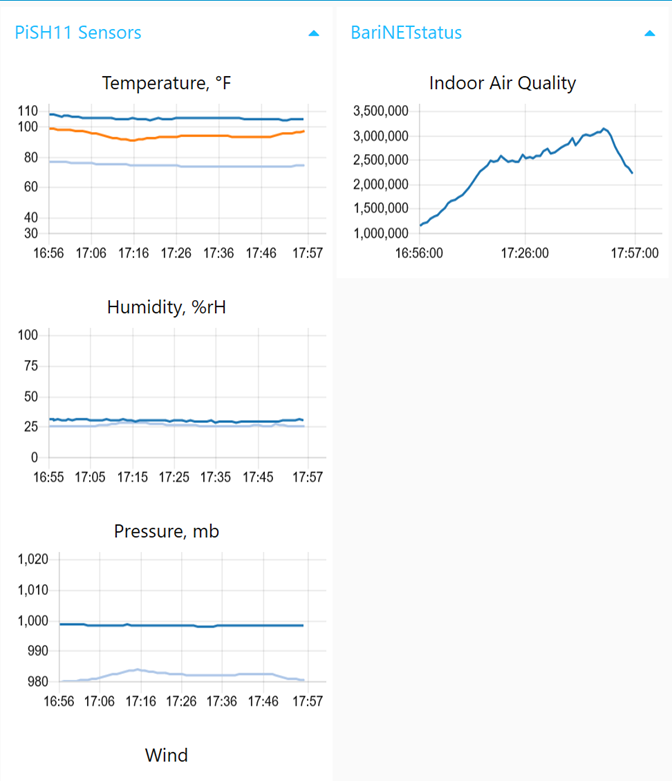
DashboardThe dashboard shown below derives the charts from Node-RED workflows. One of the advantages of this approach is that the chart widgets output data that can propagate the number crunching. There is a second dashboard based on the openHAB package. Since this package a richer set ofcontrols, the farm’s use of the capabilities is not limited to sensors but also home controls such as thermostats, lights and multiple vision processing systems. This topic will be examined in a future note too.
Telemetry logging conducted in a planned manner provides several advantages for data processing.
Advantages
The advantages ensuing from the use of distributed servers for the farm include but not limited to:
· Scalability
· Availability
Scalability
Using one or more slave servers, permits the separation of read operations (e.g. data warehousing scenarios) from write operations on the master server. This approach in turn improves the performance of theservers in the pool owing to distributed but dedicated functions.
Availability
The slave servers supports streaming analytics (for machine learning applications) since these servers have near real-time data to support intensive read queries.
ReferencesAzureSphere MT3620 Development Kit
Higher Availability and Performance for your Databases
The R Project for Statistical Computing






Comments
Please log in or sign up to comment.