- Programming in C/C++ (for the microcontroller)
- PCB design (on Kicad, Altium,...)
- Knowledge in electronics (especially reading datasheets)
- Use software such as TTN and Beep
Bees are threatened...
Global Bee population is decreasing every year due to what is known as Colony Collapse Disorder (CCD), which is a phenomenon of abnormal and recurrent mortality of honey bee colonies.
Bees are not only used to produce honey; they are also responsible for at least 80% of pollination, and thereby about 35% of the world's food production as it depends on this pollination.
They are threatened by multiple factors: pesticides, viruses, parasites, predators (varroa, Asian hornet), pollution, climate change partly linked to the increase of CO2, genetically modified plants or even the theft of hives
... So how can we help them?
As part of our 4th year embedded systems engineering project, we built a connected hive system, allowing us to collect data on the state of the hive, and to track their health remotely on a user interface on both the Ubidots and BEEP platforms. This system is designed for beekeepers who do not always have the time to physically check on their hives and/or who would like to have a more detailed follow-up of their hives.
Our project can be summarized as follows (with a horned beast: a classic project management tool, which represents a fundamental part of a product development besides the technical part):
Therefore, we have different data that can be analyzed:
- Weight: allowing us to keep track of honey production, and to tell when and if the hive is moved, which would indicate theft or the hive falling off its metal stand.
- Temperature (internal and external): to monitor the living conditions of the bees
- Humidity (internal and external) : also to monitor the living conditions of the bees
- Sound: to monitor the bees’ buzzing frequencies, which could indicate whether the bees are in good health and if a queen is present or not.
- Battery: to ensure that the system has an adequate power supply; it is recharged by the solar panel located atop the hive structure.
Our components are therefore deployed as follows:
a) Introduction
We will approach the entire development process of our project by detailing the operation of each sensor with the PCBs created, as well as the transmission of gathered data and the alerts produced by the system.
First of all, we established a list of the data we needed to have with the various associated sensors. Once we received all the hardware (listed above), we could start carrying out tests. At first we carried out tests on each sensor independently, then we built and tested the entire system on a solderless breadboard.
b) Sensors
b.1) Microcontroller
(Datasheet link: https://docs.arduino.cc/hardware/nano-33-ble-sense, tab datasheet)
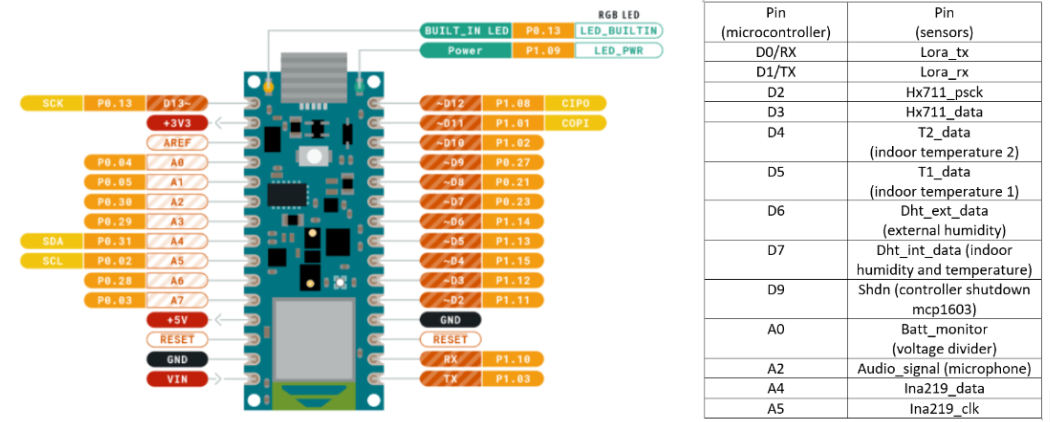
For this project we chose the Arduino Nano 33 BLE, it’s a small board, easy to handle, with enough pins, and with several useful features, such as Low Energy (BLE).
b.2) Humidity
(Datasheet link: https://www.gotronic.fr/art-module-capteur-t-et-humidite-sen-dht22-31502.htm, tab technical specifications sheet)
To monitor humidity, we used DHT22 sensors, one for indoor and one for outdoor use. To protect the outside sensor, especially from rain, we 3D-printed a case whose design we found on https://www.thingiverse.com/thing:4080321.
b.3) Temperature
(Datasheet link:
probes : https://www.gotronic.fr/art-capteur-de-temperature-grove-101990019-23842.htm, tab technical datasheet /
screw terminal : https://cpc.farnell.com/seeed-studio/103020007/grove-screw-terminal/dp/MK00578, tab technical datasheet)
For the interior temperature, we used temperature probes that are long enough so that we could place the box under the hive where it would be protected from the elements and still be able to insert the probes where they need to be.
b.4) Weight
(Datasheet link:
Strain gauge : https://www.gotronic.fr/art-capteur-de-force-500-kg-czl301-20800.htm, tab technical datasheet /
amplifier hx711 : https://www.gotronic.fr/art-amplificateur-hx711-grove-101020712-31346.htm, tab technical datasheet)
To keep track the weight of the hive, we chose to use a strain gauge, attached to a metal stand, with an amplifier so that the data can be correctly interpreted.
b.5) Sound
(Datasheet link:
Amplifier max4468 : https://eu.mouser.com/ProductDetail/Maxim-Integrated/MAX4468EKA%2bT?qs=1eQvB6Dk1vi4f2y%2F76B2dg%3D%3D, MAX4468EKA+T Datasheet)
From the beginning, we observed that the microphone didn’t work the way we wanted it to due to the loose connections typical of solderless breadboards, and this prompted us to make a dedicated PCB for the microphone amplifier circuit.
For the frequency analysis, we focused on a low-frequency range of about 500 Hz total: 98 Hz to 583 Hz, split over ten intervals of about 48 Hz each. We chose this specific range as it would allow us to distinguish different situations at different frequencies such as:
- High spectral density at approx. 350 Hz could indicate quacking, which is a phenomenon in which multiple queens are present and would fight to become the queen of the colony.
- High spectral density at approx. 450 Hz could indicate tooting which happens when a bee signals that she is the future queen to be born (allowing other potential queens not to be released by workers).
- High spectral density at 510 Hz could indicate that the colony is in bad health.
b.6) Brightness
(Datasheet link:
Solar panel: https://www.gotronic.fr/art-cellule-solaire-sol2w-18995.htm, tab technical datasheet /
Power adapter card (LiPo Rider Pro) : https://www.gotronic.fr/art-carte-lipo-rider-pro-106990008-19050.htm, tab technical datasheet /
Voltage regulator : https://www.pololu.com/product/2122)
In order to measure the exterior brightness, we decided to use the solar panel (whose other purpose is to recharge the system’s battery, of course) coupled with a wattmeter as the power supplied by the solar panel is roughly proportional to outdoor brightness.
b.7) Battery life and consumption
(Datasheet link:
MCP1603 shutdown controller : https://www.microchip.com/en-us/product/MCP1603#buy-from-store)
Throughout this project, we have made continuous efforts to reduce the system’s power consumption, both by using the low power mode (to limit the current when the system is not sending data and is in standby) and by adding a voltage regulator (shutdown) which has had the desired effect, greatly increasing the systems battery life.
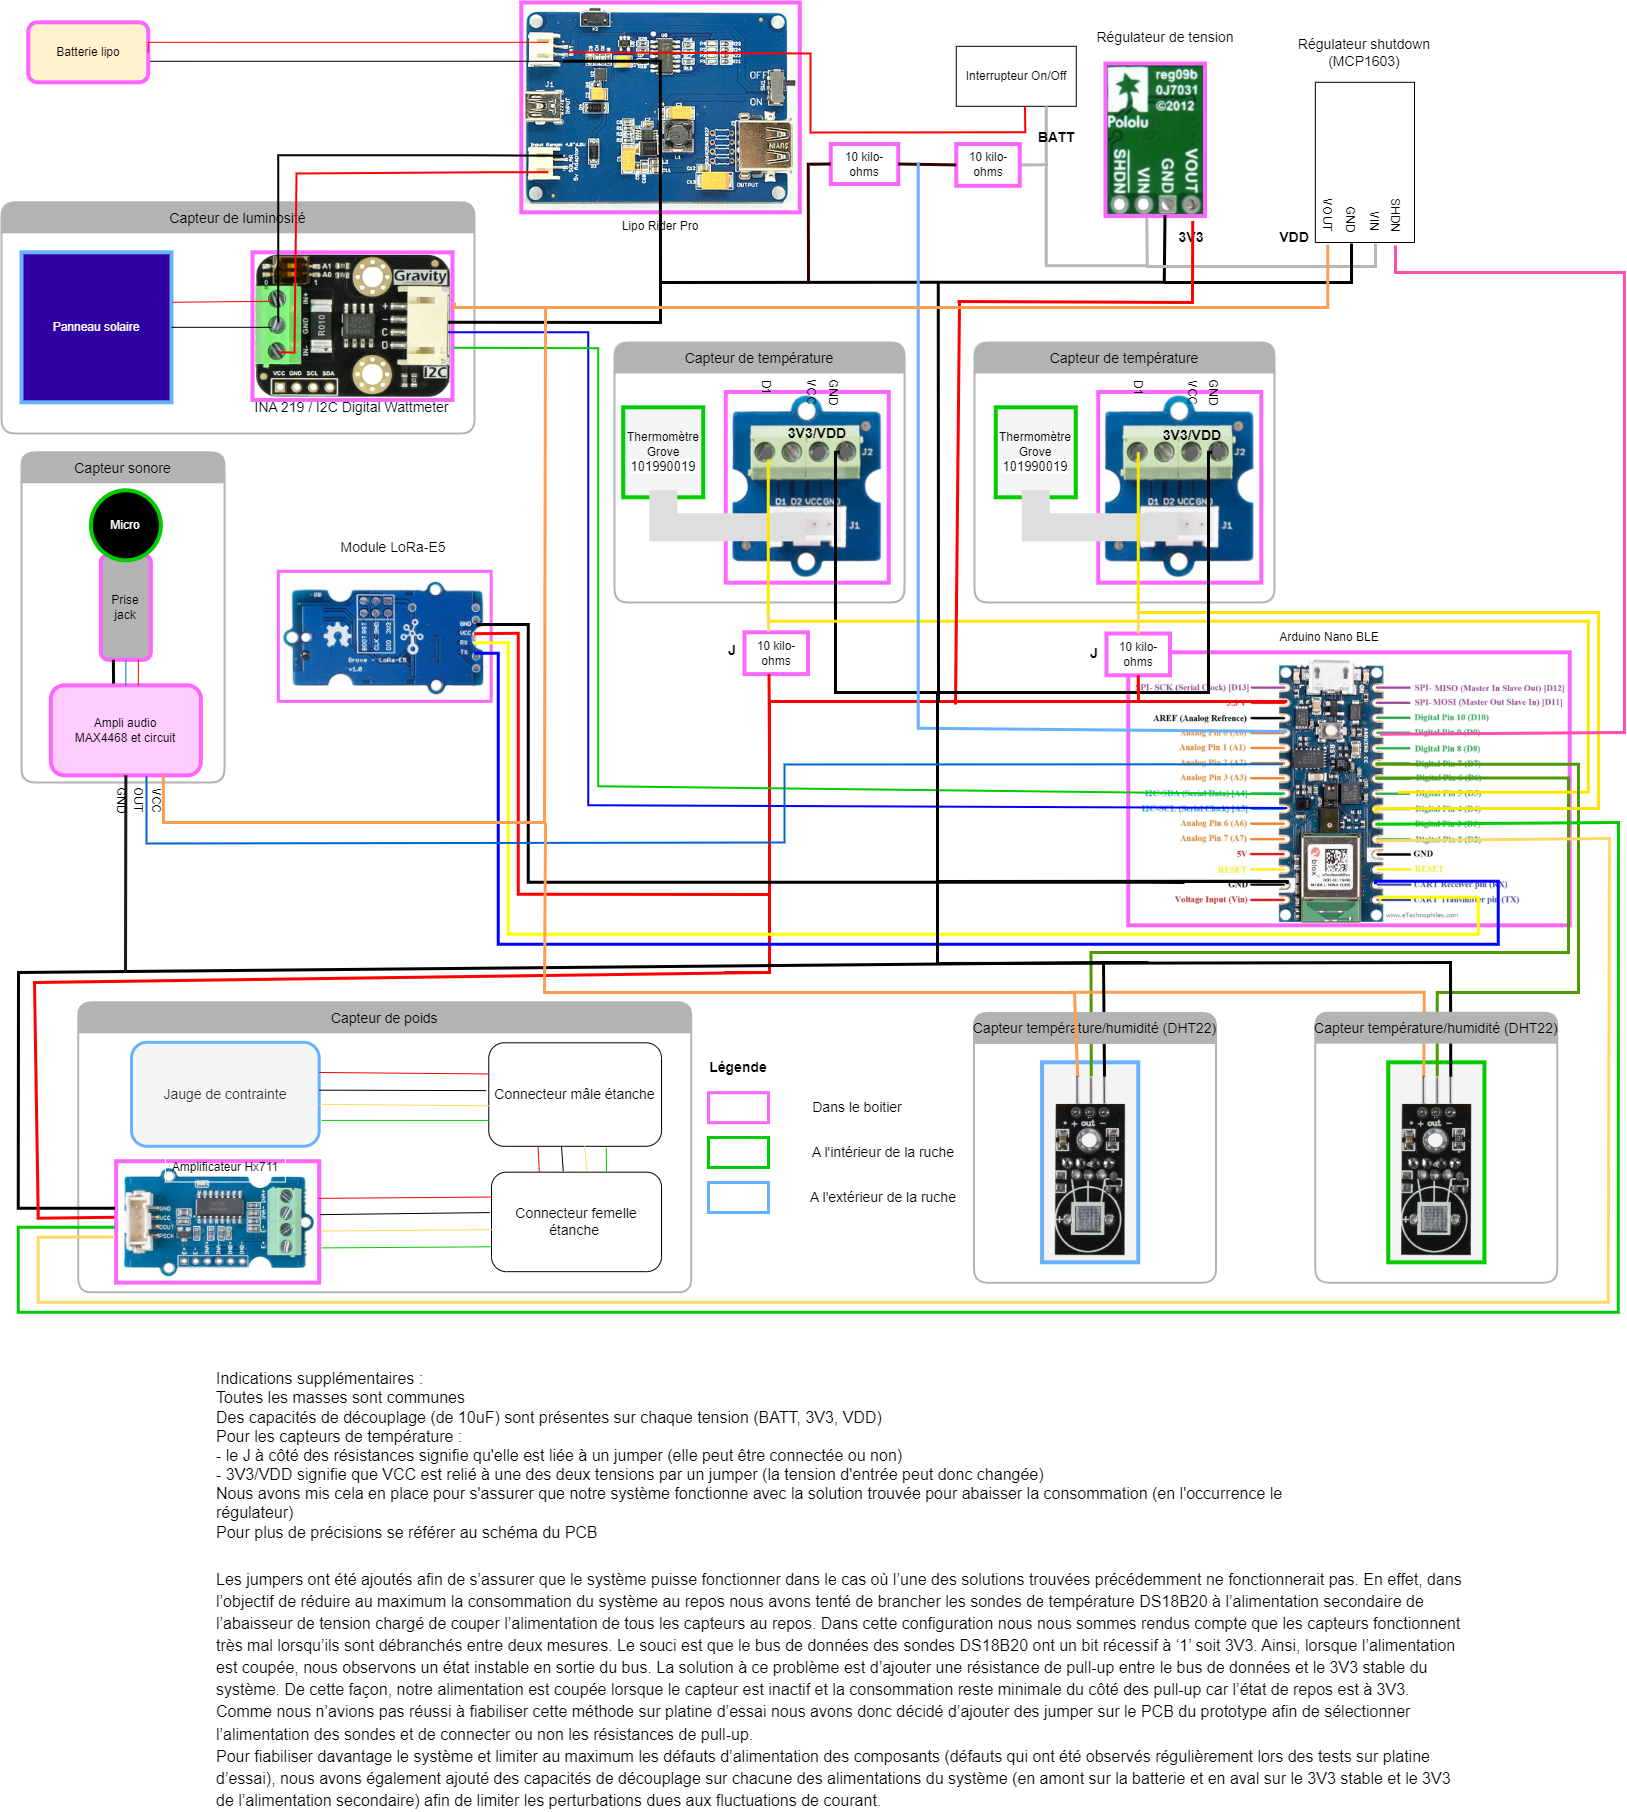
All the connections are detailed on the diagrams (available in appendix on the electronic diagram document where other information is explained, or available with the pcb project file).
For the tests conducted, we followed the same protocol:
Make sure the components are properly pinned, use a test code with the necessary libraries, make sure we have consistent measurements.
Our system’s: data accuracy tolerances:
(For the battery, it is displayed in volt, the alert is notified according to a percentage of battery, however 0% does not correspond to 0V)
c) PCBs
During this project we made two PCBs: one for the microphone amplifier circuit, and one for the rest of the system. The associated files are available in the appendix, at the bottom of the page.
For each PCB, the first steps were to make an electrical diagram of the system to be printed, followed by choosing the footprints according to the components, followed by generating a netlist and then designing the pcb by placing the different components and by drawing the strips that should not cross each other and be compact enough so that the PCB could fit in the waterproof casing.
The last steps were printing the PCB, performing a continuity check to verify the correct printing, soldering the components, and finally testing the fully assembled system.
c.1) Microphone
For the realization of this printed circuit, we used the circuit diagram appearing in the datasheet of the component MAX4468:
We added a decoupling capacitor of 10uF to ensure signal stability, which is shown in the shared PCB file (its name on the schematic is C5).
c.2) Full system
Once all the sensors were functional on the solderless breadboard prototype, including the microphone, we made the final printed circuit board of the complete system.
The details of the diagram are available in the file in the appendix with some explanations of its functioning. Below is a visualization of our PCB:
We ended up with a slight difference from our original design. We soldered the temperature sensors in parallel which left one groove connector vacant. This connector could potentially be used for the addition of a component in the future.
d) Data transmission and display on our interface
To transmit the data collected by the sensors, we have chosen to use the LoRaWAN network via a LoRa transmitter and receiver module, to which we added a Molex antenna to increase the range of the system (here we will discuss it briefly but you can get the details of our procedure with our attachment file ).
Below we recap some of the steps taken:
- Connecting our device (with its AppEUI, DevEUI and AppKey credentials) to the LoRaWAN network (LPWAN)
- Transfer of data from TTN to BEEP (with the webhook)
- Data formatting (with the payload formatter)
- Data transfer from our microcontroller to BEEP
Finally, we have set up a user interface on the BEEP platform, the goal being to have a simple display of the data provided by the system embedded in the hive which is sent from the hive once every 10 minutes.
One problem we ran into was one of our two humidity measurements not working as expected: one of the elements (variables) of the TTN payload (h_i) was not appearing in the BEEP dashboard, so we decided to piggyback this data on a temperature variable, which ended up showing as temperature given in °C despite actually being a percentage.
e) Alerts
In order for the data to be of real interest, we have set up alerts on the recovered data that notify the beekeeper in case of problems or for any events that would be useful to take note of.
Those alerts are the following:
- Swarming (when the weight decreases by a few kilograms, about 3kg)
- High hive weight (related to honey production, when the weight increases by about 10 kg)
- Hive weight too low (which could indicate that the bees have not returned, not related to swarming, or due to honey theft)
- Theft of the hive (with a weight below 0)
- Temperature too low (to prevent unfavorable living conditions of the bees, which would allow the beekeeper to intervene when needed by covering the hive, for example)
- Low battery charge (which will remind the beekeeper to put the battery on charge and to use another one in the meantime)
Each alert is set up on the BEEP website by choosing a measurement value and a threshold. As the alerts are performed on all of the hives involved in the project by default, we added the hives other than the one we have worked on to an exclusion list.
Just like we did for the sensors, we checked that each alert was functional, according to the specifications given above.
Below, is the list of alerts set up for the system:
f) Waterproof case
Once everything in the system was up and running, we were able to pack it all into a plastic waterproof housing, which should be able to withstand the various temperature conditions our system will be subject to. To do this, we drilled holes in the case to place cable glands through which we ran the waterproof cables, which we extended by soldering and using heat-shrink tubing. In addition, in order to hold all the components in place, we modeled and 3D-printed a rack (the files are in the appendix).
Here is a picture of our prototype in its box:
We ran the microphone cable directly through the gland used by the solar panel (on the roof), and drilled the housing to place the connector and connect it to the strain gauge cable.
Finally, we sewed a small pocket out of packaging foam in which we placed the battery in, providing thermal insulation for the battery as cold temperatures are highly detrimental to the performance of lithium-ion batteries.
g) Final tests
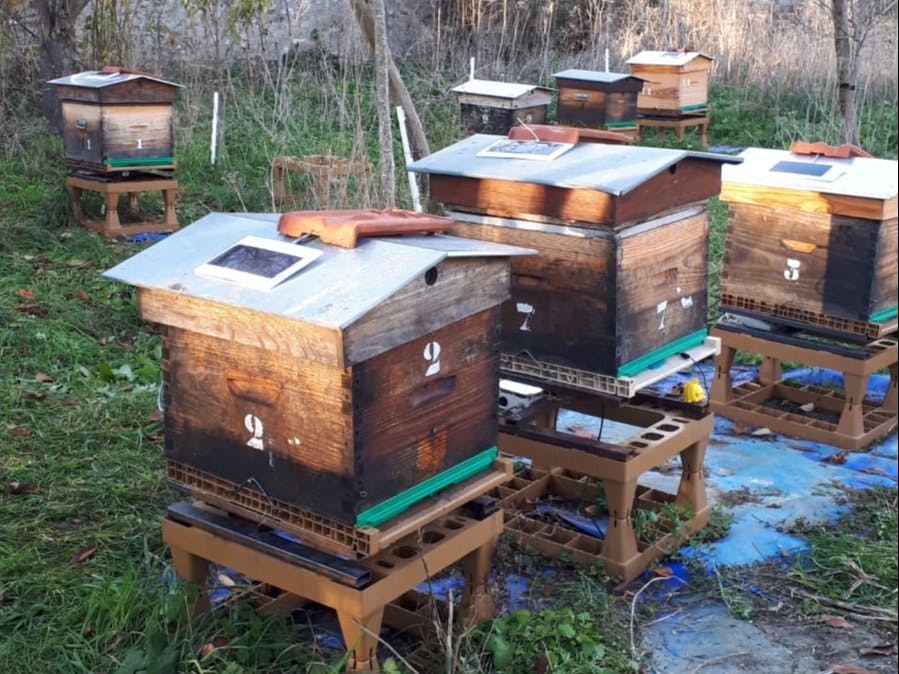
Once our prototype was finished, we installed it on a hive at our partnered apiary, in order to carry out field tests in real-life conditions.
We left our system running for 2 weeks, at the end of which we obtained the following results on BEEP:
In conclusion, this project has been a great experience in embedded systems design and building as we had the opportunity to make an embedded system from A to Z that met a certain real-world need.
We were able to attain the objectives we had set for ourselves all while acquiring new skills, such as programming Arduino boards, using the LoraWAN network, designing, printing and checking a printed electronic board (PCB), modeling and 3D-printing bespoke parts, optimizing the current consumption and battery life of an embedded system, setting up a user interface on Ubidots and Beep., to name a few.
This project has been a way to apply our theoretical knowledge and enrich our skill sets not only from a technical point of view but also from a managerial one, by organizing depending on the tasks that needed to be done and by using standardized tools facilitating the management and the evolution of the project.
Contact :If you have any questions, for additional information you can send an email to the following addresses:
Michael.Baudeur@etu.sorbonne-universite.fr
caroline.alonso.1@etu.sorbonne-universite.fr


_4YUDWziWQ8.png?auto=compress%2Cformat&w=48&h=48&fit=fill&bg=ffffff)


_Ujn5WoVOOu.png?auto=compress%2Cformat&w=40&h=40&fit=fillmax&bg=fff&dpr=2)


Comments
Please log in or sign up to comment.