There are many refineries east of downtown Houston, Texas. Sometimes there are shelter in place alerts because of gas leaks. I wondered if all of the accidents are reported, so I created a system to continuously monitor the air for methane, the major component in natural gas. This is using the internet of things for a good cause (public safety and pollution reduction), so I submitted it to the "IOT for Good" competition.
A battery powered microcontroller based sensor sends data to the internet using a public wireless network. This makes a portable sensor. I used the Helium LoRaWan network because it has a long range and is designed for small data volumes like sensor readings.
I selected the Helium network because it is a large network in Houston available for public use. I hoped the network would provide me coverage but I ended up providing my own hotspot, which has become part of Helium's network. Even though I provided my own gateway, Helium provided the important "Internet backhaul" (collecting data received by the gateways, removing duplicates, and forwarding data to an application server). My application server is a dashboard with graphs of my sensor data running on MyDevices.cayenne, com.
This Natural Gas detection system can also be used to monitor leaks in oil and gas fields. Oil and gas companies want to minimize these leaks because these emissions are lost product and EPA may regulate this greenhouse emissions (See “ExxonMobil Field Testing Methane Detection Tech” https://www.rigzone.com/news/exxonmobil_field_testing_methane_detection_tech-13-apr-2020-161731-article).
The “Natural Gas Detection” project is based LoRaWAN. Figure 1 is a diagram of a LoRaWan system. This tutorial describes how to:
- Setup sensor node and hotspot hardware
- Register the node to the Helium LoRaWan network
- Program the end node
- Create a Helium “integration” required to send data to an application server to create plots
- Create a dashboard of plots using cayenne.mydevices.com
Setup sensor node and hotspot hardware
The section “Things Used in this Project” lists hardware and websites that offer the components for sale. Figure 2 shows assembled hardware: the LoRaWan hotspot, the Arduino/ELEGOO/Dragino sensor, and the STM sensor. The ELEGOO/Arduino MEGA 2560 microcontroller with Dragino shield is easier to program than the ST Microelectronics (STM) development board.. The ELEGOO was about half the price of the Arduino at Amazon. I own both ELEGOO and Arduino boards and they perform the same. The Dragino shield for Arduino is less expensive at the Robot Shop than at Amazon, but I am unsure if the versions are identical. I bought from Amazon, the only source I knew at the the time. The product is described at: http://wiki.dragino.com/index.php?title=Lora_Shield. I started with an MQ-3 alcohol sensor and used a bottle of 70% isopropyl alcohol for testing. I changed to an MQ-4 (a methane sensor) before deployment.
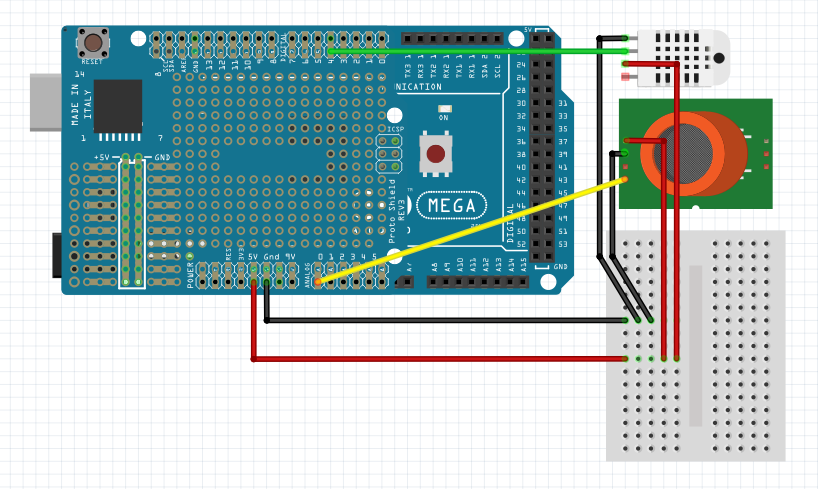
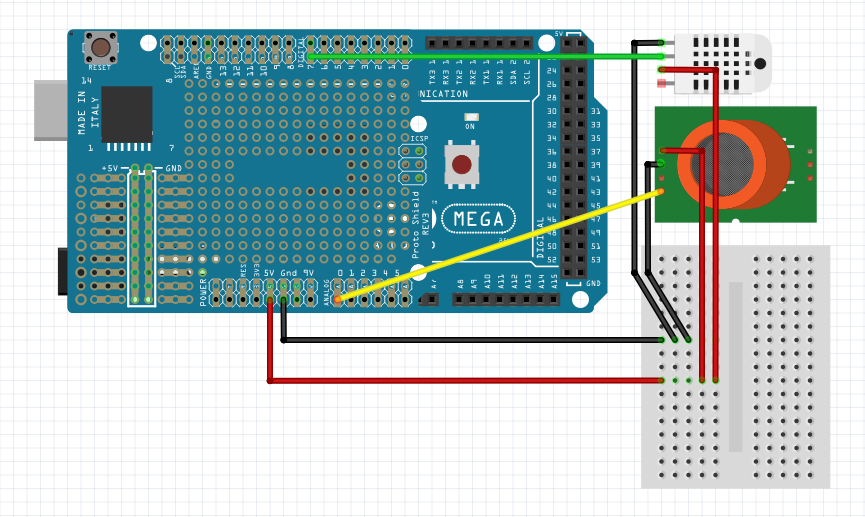
The Fritzing circuit diagrams (figures 8 and 9) are in the Schematic section at the end of this tutorial. The STM and ELEGOO wiring are similar, differing only by the GPIO pin used for the DHT11 (Digital Humidity and Temperature). The ELEGOO/Arduino uses GPIO pin D4, while the STM uses GPIO D7.
I hoped to use existing Helium network hotspots, but there are none near my house. Rather than buying an assembled hotspot from https://shop.helium.com, I decide build my own to save some money and learn more details. I used the instructions at https://developer.helium.com/hotspot/developer-setup. I never got my Hotspot completely stable (there were errors and omissions in the instructions) and when the Emrit host program offered free hardware (https://www.emrit.io) I stopped working on my DIY hotspot. It was a long wait, but Emrit’s hotspot was easy to install. I believe the wait is much shorter now, but the free Emrit host program may be a limited time offer.
Register the nodes to the Helium LoRaWan network
This section closely follows the instructions at https://developer.helium.com/console/quickstart and https://developer.helium.com/console/adding-devices
Go to https://console.helium.com , create an account and log in. Click devices in the left column, and click the “+ Add Device” button. Enter the “device name” field, and click the “Submit” button. I like to define a device names containing the name of the microcontroller and the sensors. On this project these names are arduino_dragino_gasdht and stm_gasdht. The console automatically fills in the Dev EUI, App EUI, and App Key, and I do not change these values.
Program the end node
I adapted the instructions at https://developer.helium.com/devices/arduino-quickstart/sparkfun-pro-rf to create the arduino_dragino sketch included in the code section later in this tutorial. The most significant change is:
- the pinout on the Arduino-Dragino are from http://wiki.dragino.com/index.php?title=Lora_Shield#Example1_--_Use_with_LMIC_library_for_LoRaWAN_compatible
The steps to setup the libraries in the Arduino IDE are:
- Navigate to Library Manager (Sketch > Include Library > Manage Libraries). Search for LMIC and selecting the MCCI LoRaWAN LMIC library instead or the IBM LMIC Framework
- Navigate to Library Manager (Sketch > Include Library > Manage Libraries). Search for DHT and selecting the DHTStable library by Rob Tallaart.
- Navigate to Library Manager (Sketch > Include Library > Manage Libraries). Search for Cayenne and selecting the CayenneLPP library from Electronic Cats.
I followed the instructions at https://developer.helium.com/devices/arduino-quickstart/st-discovery-lrwan1 to program the STM B-L072Z-LRWAN1 STM32 LoRaWAN™ Discovery Board. My only addition is to install the DHT11 library. Navigate to Library Manager (Sketch > Include Library > Manage Libraries). Search for DHT and selecting the DHTStable library by Rob Tallaart. The Cayenne library is distributed with the board support. I also changed my sketch to send gas, temperature, and humidity values instead of “Hello, World!”.
Use the Sketch for the ELEGOO/Arduino MEGA microcontroller Dragino LoRa Shield gas sensor or the STMicroelectronics B-L072Z-LRWAN1 gas sensor in the Code section later in this tutorial. Search for the APPEUI, DEVEUI, and APPKEY and copy the values from https://console.helium.com/devices. In the arduino_dragino_gasdht script you need to expand the hex digits before cutting and pasting them into the sketch. Be sure to change Device EUI and App EUI byte order to “lsb” as shown in Figure 3. Be aware that the order of the “Device EUI” and “App EUI” are different in the helium console and the sketch code. (Avoid copying your EUI’s into the wrong variables!)
Cayenne has no data type for gas concentration. I sent the data a "humidity" and it plots as %. This is better than sending as "temperature" because that leads to yaxis on the plots to be labeled Fahrenheit or Celsius.
Create a Helium “integration” required to send data to a server to create plots
Leave the program from the previous section running with LoRaWAN.sendPacket sending Cayenne low power payload (lpp) every 10 seconds (i.e. const unsigned TX_INTERVAL = 10; in the Arduino sketch or delay(10000); in the stm sketch). Data packets from a sensor are normally sent every 15 to 120 minutes, but for initial configuration and setup we want frequent data packets. Your console should look like Figure 4 with blue dots showing 10 byte data packets arriving about every 10 seconds.
I do not fully understand the Helium concept of labels and integrations described in the developer.helium.com documentation and tutorial videos, but I will share my working approach. I decided to name both the label and integration “mydevicescayenne_gasdht”, and I used them for all my gas/hdt sensors that I visualize with mydevices.cayenne.com. The rest of this section describes my approach in detail.
Create a label for this sensor by clicking the “add label” button beside “Attached Labels” in the Helium console “Devices” page (shown in Figure 4). I called the label “mydevicescayenne_gasdht” (the name reminds me the label is used to send data to the mydevices.cayenne.com to create a dashboard). Now create the integration with:
- Click “Integrations” in the left column
- Click “myDevices Cayenne”
- Name the integration in the “step 3 box” the same as the label (“mydevicescayenne_gasdht”)
- Apply the integration to label by entering “mydevicescayenne_gasdht” in the “add a label” and clicking the “Add” button.
- Click the “Create Integration” button.
I repeated this for my other device, reusing the “mydevicescayenne_gasdht” label created above. You can “Choose a Label” after clicking the “+ Add Label” button.
Create a dashboard of plots using MyDevices.cayenne.com
This section describes how to create a dashboard that displays the data sent from the Helium console. There are several steps:
- Create an account and login to cayenne.mydevices.com.
- Select “Add new...” → Device/Widget.
- When Devices * Widget panel appears select “Helium” then “Cayenne LPP”.
- In the “Enter Settings” panel change the name of the device to “Cayenne LPP stm 4FBB”. I append the type device (stm) and the last 4 hex digits of the Device EUI
- In the “Enter Settings” panel change paste the “Device EUI” from the device section of the Helium Console into the DevEUI box.
- Click the “Add device” button. The dashboard appears as shown in Figure 5.
- Select the gear in the upper right of the “Humidity” Widget and pick “settings”. Change the “Widget Name” From “Humidity (1)to “Gas % of Max (1)”. Change “Choose Widget” to “Line Chart”. Click the “Save Button”. Check the “Enable Max/Min...” and set the min 0 and max to 100.
- The other widgets can also be modified and the widgets can be arranged in the dashboard by holding mouse button 1 down while hovering over the header of the widget. Figure 6 is an updated dashboard. This test used a gas alcohol sensor. I used an open bottle of isopropyl alcohol and observed the reading slowly increase from 50% to 80% and slowly decline after I closed the bottle. I also exposed the DHT11 sensor to warm, moist air (I breathed on it). The temperature reading rises and falls slowly, but the humidity reading responds quickly. Figure 7 shows 70 minutes of sensor reading. It takes about 30 minutes for the alcohol reading to return to original values.


Comments
Please log in or sign up to comment.