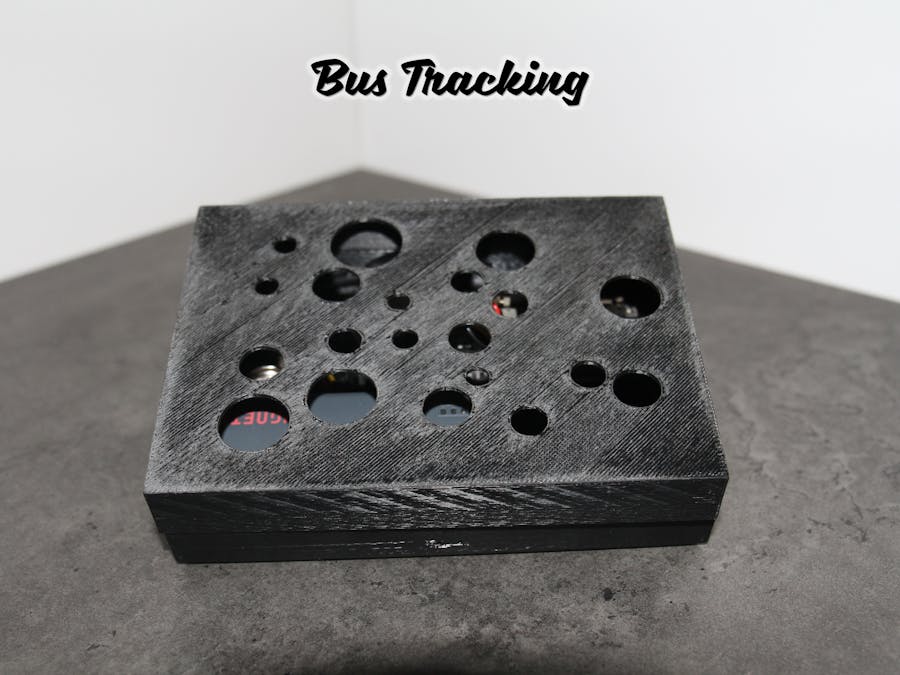
As a student, I catch the bus almost everyday, and it was while I was on the bus that I realized the potential for buses to provide data for smart cities. Buses go everywhere in a city, and this provides the opportunity for atmospheric monitoring that can provide insight into environmental data like temperature, humidity, atmospheric pressure and air quality. This also has the added advantage of allowing anybody to see the location of the bus, which would have saved me on more than one occasion. Normally data like this would be from a static monitoring station, and this limits the insight into things like temperature and humidity in an area, this project solves that by getting data everywhere a bus goes, which in my case, is most places in my city and has the added advantage of being able to see the bus location in real-time. With smart cities being a major focus point in our current day and age, this provides huge amounts of data that is visible to the population, and can be used in many other ways through the flexible Google Cloud API.
As a whole, this project aims to solve multiple problems in one, both allowing people catching public transport to view the location of their bus in real-time, as well as collecting publicly visible data along the entire bus route, providing insight into temperature and other statistics across large areas of cities.
OverviewThe idea for this project is to use the Particle Asset Tracker Kit, some sensors and the Google Cloud Platform to create a device that can track the bus, and log atmospheric data in real-time, as well as store the data to analyse at a later date.
The general plan of this project is as follows:
- Design and wire the hardware using the Particle Asset Tracker
- Design a Case to hold the hardware
- Code the tracker so that it will log the GPS location, temperature, humidity, pressure and gas count periodically
- Design a website that updates in realtime the position and data tied to the bus
- Store the data, and create a simple page that allows anybody to view the historical route and data of the bus
The goal from the outset was to make the hardware as simple as possible, because that lowers cost and makes it easier to maintain.
The Particle Electron and Asset Tracker is great because it provides a cellular connection, GPS capabilities, and a robust AI that is easy to scale.
The BME280 breakout from Adafruit is the ideal sensor for monitoring the atmospheric conditions, it provides temperature, humidity and pressure data, all over an I2C connection, which simplifies connection. In addition, there is a port of the Arduino library which makes using it even easier.
The MQ2 sensor was not my first choice for this, I already had one lying around, and when the particulate sensor I ordered was delayed, I had to resort to using this. This does have a positive side though, because it can analyse natural gas concentration, which could be useful in detecting gas leaks. Because it only requires 3 wires to connect it, it's incredibly easy to wire.
I also bought an external GPS antenna, because I use the Asset Tracker v1, which has a very weak internal antenna. I bought this off eBay for less than $5, and it provides significantly better reception.
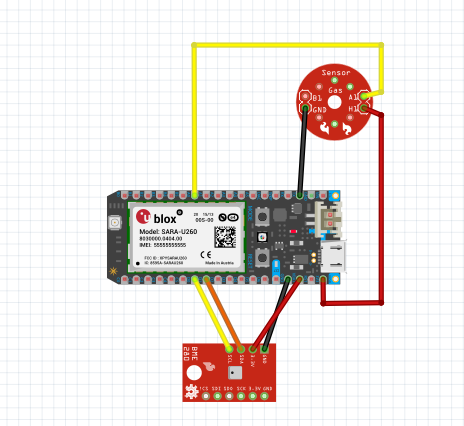
The wiring is very simple, as shown in the Fritzing diagram.
The MQ gas sensor is connected as follows:
- VIN to 3v3
- GND to GND
- AO (Analog Out) to A0
The BME280 is connected as follows:
- VIN to VBAT
- GND to GND
- SCK to D1
- SDI to D0
For the connections, I soldered jumper wires to the sensors, and plugged the other end into the connectors on the asset tracker base, which provides an easy way to connect and change pins if the need arises.
The External GPS connects to the EXT u.Fl connector on the asset tracker, and that is the hardware done, mount it in the 3D printed case and it's ready.
Creating the FirmwareThe firmware for the tracker needs to be installed on the Electron, ensuring that the relevant libraries (BME280 and AssetTrackerRK) are installed as well, this can be obtained through a quick search in the libraries tab of the Particle IDE.
The code is fully documented, and if you want to use different pins, then just change the following
// This #include statement was automatically added by the Particle IDE.
#include <AssetTrackerRK.h>
// This #include statement was automatically added by the Particle IDE.
#include <Adafruit_BME280.h>
//MQ2 sensor analog pin
#define analogMQ2 A0
Initial testing using the Official Asset Tracker Library had some issues, specifically the latitude had a tendency to be wildly inaccurate, and using the AssetTrackerRK library which uses a different GPS library proved to be much better. This has the added advantage of being backwards compatible, overall it is a much better option, as the official library is flawed.
If you are planning on using the internal antenna of the tracker kit, then you need to change the start code from
void setup(){
   //Enable Asset Tracker Shield
   t.begin();
   //Enable GPS Module
   t.gpsOn();
   //Switch to external antenna
   t.antennaExternal();
   //Begin listening on BME sensor
   bme.begin();
   //USB Debugging
   Serial.begin(9600);
}
to
void setup(){
   //Enable Asset Tracker Shield
   t.begin();
   //Enable GPS Module
   t.gpsOn();
   //Switch to external antenna
   // t.antennaExternal();
   //Begin listening on BME sensor
   bme.begin();
   //USB Debugging
   Serial.begin(9600);
}
To get this to work, there needs to be some work done using the Google Cloud API and Particle back-end.
Once you have registered your Particle, head on over to the Particle.io Console
Click 'create a new integration', and follow the instructions there. Additionally, you can follow the tutorial here to get set up using the Google Cloud API, but here is the general idea of it.
Create a project with a unique name
Create a Pub/Sub Topic
Add the correct permissions
Create a subscription
Enable the integration with your credentials
The website runs on Node.JS, and is all stored on a GitHub repo.
For this step you need a Google API key, to allow the website to pull the data from the cloud. The Particle tutorial says to do the following:
Open your list of credentials here.
All the instructions to set it up are on the repo.
Once you have cloned the GitHub repo, ensure you add your Google API key to the main directory, and change the values of this in the index.js, and then add your Google Maps API key to the historical data and the live tracking page, and you should be ready to spin up the website.
You can get a Google Maps Key here.
I use a Heroku Dyno, because of the ease of access, and it is simple to setup. Once the site is running, navigate to localhost:3000/historical or localhost:3000/index and if your device is working as well, you should see the current location shown on a map!
Final AssemblyThe final assembly is the easiest part, the 3D printed casing was just designed to hold all the components and make it look nice, so it is up to you to organize the layout internally, because it depends on the power supply, sensors and tracker kit used.
Get your 3D printed parts, grab some double-sided tape, some cable ties, and get assembling! I am using an external battery bank, but obviously if this were used in production it could be run off the internal USB power of the bus.
There are mounting holes for the Electron inside the case, and besides that, it's up to you, but this was the general layout I followed, once everything is secured, it is time for testing.
TestingIf everything is done, it should be ready to test. For my test, I couldn't actually put this on a bus, but I followed a bus around for the entire route, so the results are pretty similar to what you would get if it were on a bus. Because it was a bit wet the day I did it, I printed off a semi-waterproof enclosure to go around the tracker, that just stops the water from getting in, it's not perfect, but it worked. This temporary enclosure is included for anybody who wants it.
After securing it to the car, we were good to go. We followed the bus for a while, and I watched the progress on my phone, the results were better than expected.
The results proved to be pretty accurate, and although the initial fix took approximately 2 minutes, it maintained the fix for the duration of the trip. At most, the location was off by about 100m and this was only immediately after obtaining a fix, for the rest of the time, it was off by up to 5m, so accurate enough for this.
The temperature, humidity, pressure and gas data also worked flawlessly. This is easier to see on the website, wherein the color of the line between each point is based on the specific data between those two points, and this can be toggled with the drop-down menu on the page. This makes it easier to see the variation of the data over time, as the line changes from green to red based on the data.
If you want to see this data, you can visit my Heroku to see the data I collected.
ConclusionOverall this device solves the problems I set out to solve, it simultaneously shows the location of the bus in real-time, making it easier for commuters to know where their bus is, and it collects atmospheric data that can be useful in monitoring the environment in any area that a bus goes, monitoring for climate change, as well as partial air-quality with the gas sensor, which can be used to detect significant gas leaks. This project provides the foundation for taking this concept further, adding a particle monitor or any other sensor is trivial with some minor changes, but in the current state, works perfectly for this use.


Comments
Please log in or sign up to comment.