

Hardware components | ||||||
_zhWsCcSEcl.jpg?auto=compress%2Cformat&w=48&h=48&fit=fill&bg=ffffff) |
| × | 1 | |||
 |
| × | 1 | |||
 |
| × | 6 | |||
 |
| × | 6 | |||
 |
| × | 6 | |||
 |
| × | 2 | |||
Software apps and online services | ||||||
 |
| |||||
 |
| |||||
| ||||||
This project was part of the Lane Tech HS Physical Computing Lab course. It was created as part of the Data Visualization project.
SummaryThe main goal of this project was to produce a light-based visualization of Cyberpunk 2077 ratings over the course of launch and subsequent days. Due to limited time and closing deadlines, data of the ratings had to be prerecorded to be used later as a proof of concept rather than a live demonstration. This ended up causing much more struggle and issues than just creating a live visualization.
StepsThe first step to realizing my project was identifying a useful database API, learning to use it, and implementing it within the span of about a week. The most direct API which I could find that would openly provide access to user ratings was RAWG.io. It quickly became obvious that this was likely not the best nor most accurate measure of user experience, but at this point, I was low on time, and all of the more mainstream services such as Steam, or even GOG, required either a multi-step authorization process or simply didn't allow such access.
Pulling the data from the API was the source of the first issue. Within the span of the recent year, Particle changed how they receive webhook data, or more specifically, JSON objects. If the object is above a limit of 512 characters, Particle will split the object into multiple indexed hook-responses. This made it hard to parse the data, so I needed to do some research and with the help of my teacher, was able to learn about mustache templates, which pull data from a JSON object before it arrives as a hook response, giving just the number which I needed.
If I was doing this as a live demonstration, this would have signalled the near end of my project on the software side, as all that I would have needed was some LED light show magic. However, because I needed to record this, I dumped this data into a Google Sheet.
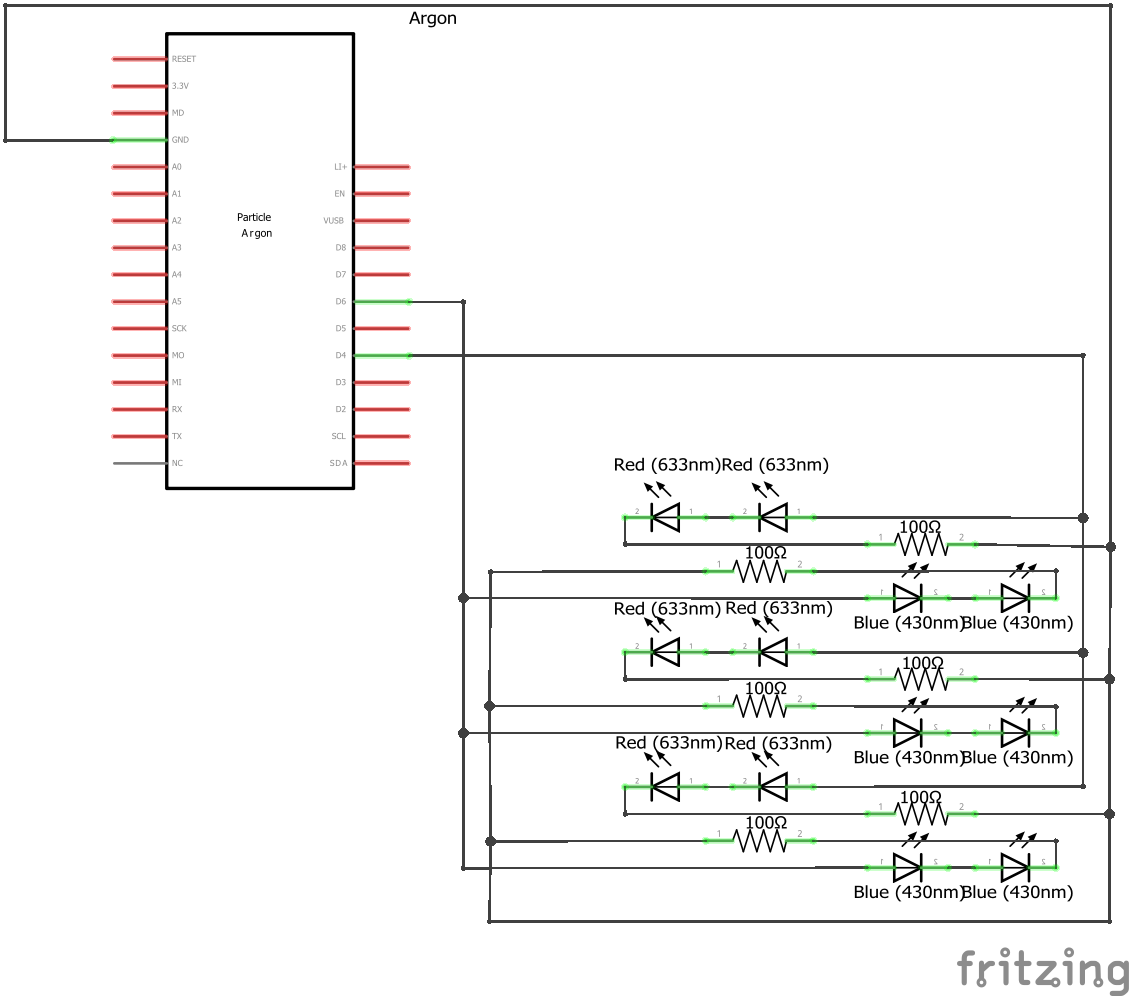
Now that I had my numbers running in the background, I got to work making my display. The first task was deciding how I was gonna organize my array of LEDs to give off the effect I wanted.
After that, I realized that if I wanted to truly polish this up, I'd have to eliminate the ugly breadboard everything was plugged into. My solution? Cover it with paper that has a nice picture on it and cover that with tape so that it refracts the light and looks shiny.
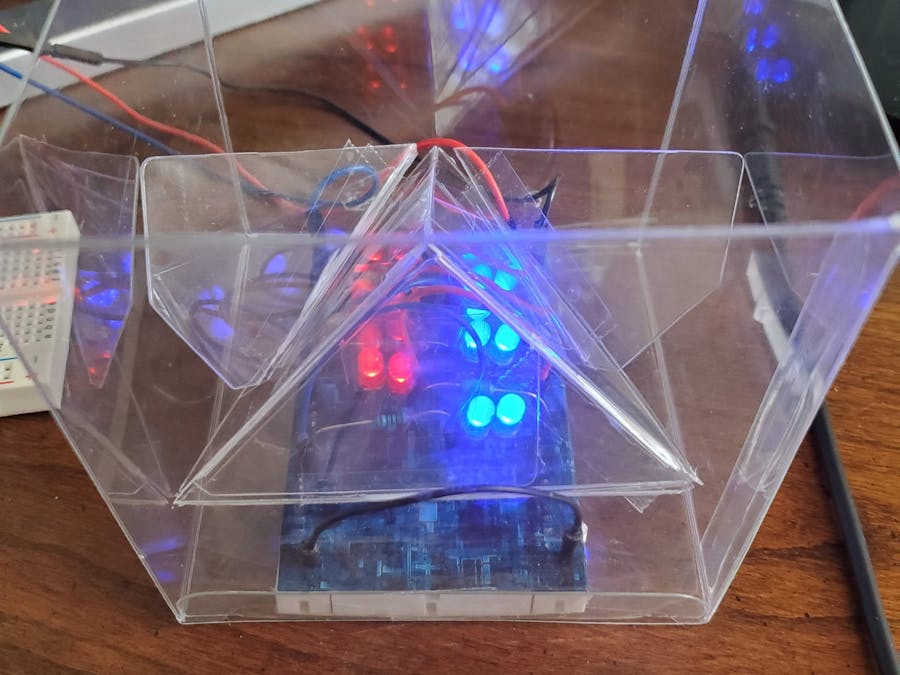
Here is the part where it really depends on what you want your project to look like and what material you have access to. Since this was a proof of concept, I found some little plastic boxes and cut them out, taped together a shape I thought might look cool, and do a good job of refracting the light to give the project that Cyberpunk vibe. This is a purely creative component, so you can do whatever.
I then realized that I would need to run my power cables through the plastic box, so I punched some holes in the side and slid the breadboard in to test the fit.
Unfortunately, phone cameras are not the best at accurately displaying small and defracted light, so the picture looks bad, and I can only promise that it looks better in-person.
Next, I loosely inserted the plastic shape into the box over the LEDs and tested out how that looked. (Spoiler: Lights on in a room make it hard to see diffracting light from a small LED.)
I then did a better job of positioning the plastic shape and set up a better background to show off the results. The fading LEDs are to show the start/stop of the sequence. The stable color of the shape represents the overall user rating of the game, while any blue/red light signifies an increase/decrease in rating respectively. Obviously sped up for time's sake and other issues.
You will notice that the stable color barely changes, even though the game is at this point infamous for its bad release. This is because the database I used allowed users to rate the game before launch. This skewed the results into the positives and is the reason why the blinking visualization is needed. I also had issues with the size of the data, as I used http://gsx2json.com/ to turn my Google Sheets data into a JSON object, but I was limited to the 512 character limit of Particle hook responses. This meant that the runtime of the visualization is actually shorter scale-wise than I initially intended.


Comments
Please log in or sign up to comment.