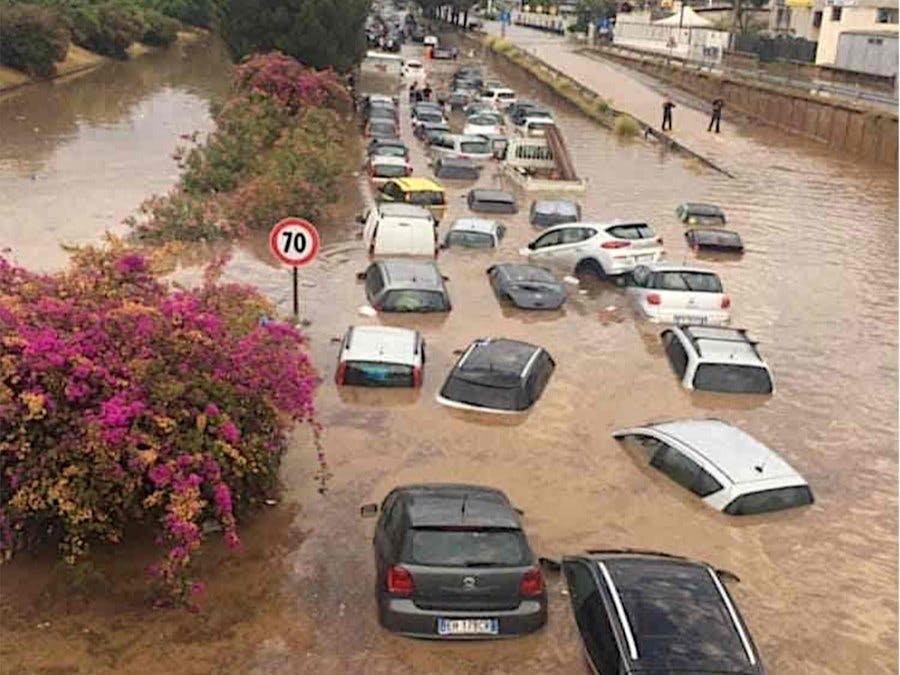
Italy is a beautiful nation but, due to its morphological conformation, it has always been subject to events such as floods, and landslides. In recent days, in the Marche region, due to a violent storm,
11 people have died and two are still missing. Obviously we cannot stop the rains or stem streams and rivers effectively but what we could instead do is study a warning system that can warn the residents of the affected areas to stay safe and not to go out.
Many of the dead were in fact people who remained outside, perhaps in their cars, unable to escape to death.
This tragedy of a couple of days ago shocked me a lot but this project was originally born for a very selfish purpose, to monitor a watercourse that flows near my house. Sometimes, in case of heavy rain, the water level of the stream rises a lot and it overflows, flooding the neighboring land and my house.
This monitoring system would allow us to have the perception of the rising water level and we could therefore organize ourselves in the best way, for example by moving valuables or appliances upwards and moving mobile cars to a safe place.
The VideoThe realizationTo realize my project I started from the tutorial on the link: Quick Start With SenseCAP-K1100 - Seeed Wiki (seeedstudio.com) and I inserted the Grove Relay and the Grove Moisture Sensor in the Wio Terminal connectors.
At first I thought about using the LoRa connectivity. I've tested the Grove-Wio E5 configuring the board to work at 868 MHz but signal strenght was too low and I could send a message correctly every 8-10 messages sent. I used an 868 MHz antenna but too few messages arrived to destination. Unfortunately, my home is a little out of town so I don't have optimal signal coverage. The signal level is between 1 and 2 notches. For this reason, not all packets are sent successfully.
I configured my Wio Terminal on the portal http://sensecap.seeed.cc, following the steps described to bind my device. For simplicity, I used the web portal and setting up my device was quick and easy.
The dashboard is full of information, has a very simple interface and is very intuitive. We can view the characteristics of the device, its status, the values of the measurements made by the sensors, and many other information. The data is displayed in both tabular and graphical form.
In order to detect floods, I added the Grove Soil Moisture Sensor board. I connected it to the right input and it immediately started to work, just click on the first button at the top (sense) to get the values of all the sensors, including the inserted one. In my case I can read the values of: Light, Sound, IMU, Soil.
The representation of the data on the Sensecap dashboard is complete but it would be more immediate to see only those that interest me and when, for example, they exceed a certain threshold. It would then be more beautiful to see them on a WEB page created ad hoc and containing the values of my interest. For this I thought of using Node Red, “a programming tool for wiring together hardware devices, APIs and online services in new and interesting ways”. It provides a simple browser-based editor and tons of ready-to-use tools for viewing, calculating, etc.
I used the tutorial at the link: SenseCAP & Node-RED Tutorials - Seeed Wiki (seeedstudio.com).
The installation of Node Js and Node Red is quite simple and also the use is quite simple. Then I configured a simple flow that can show the values of moisture level (an integer) and the status of the water pump (a LED red if "ON", green if "OFF")
No way to complete the task to have a nice interface: time passes too quickly and the deadline for the project was getting closer and closer.
I thought of another way to manage the messages and the data they contain. I wanted to create something that did not use external services and that could be created and managed entirely by the user. So I thought of installing an MQTT Broker (Mosquitto) from www.mosquitto.org, a simple, light and free software that works very well. Using my PC as MQTT broker I was able to troubleshoot efficiently. Obviously this solution could create problems, for example if the user does not have a public IP address. Even in this case, however, you can use your own MQTT Broker as long as you use an external service, such as Ngrok to make our MQTT broker visible from outside our network.
Also as regards the visualization on smartphones, I have found many solutions for the management and visualization of MQTT traffic. One of these is IoT MQTT Panel.
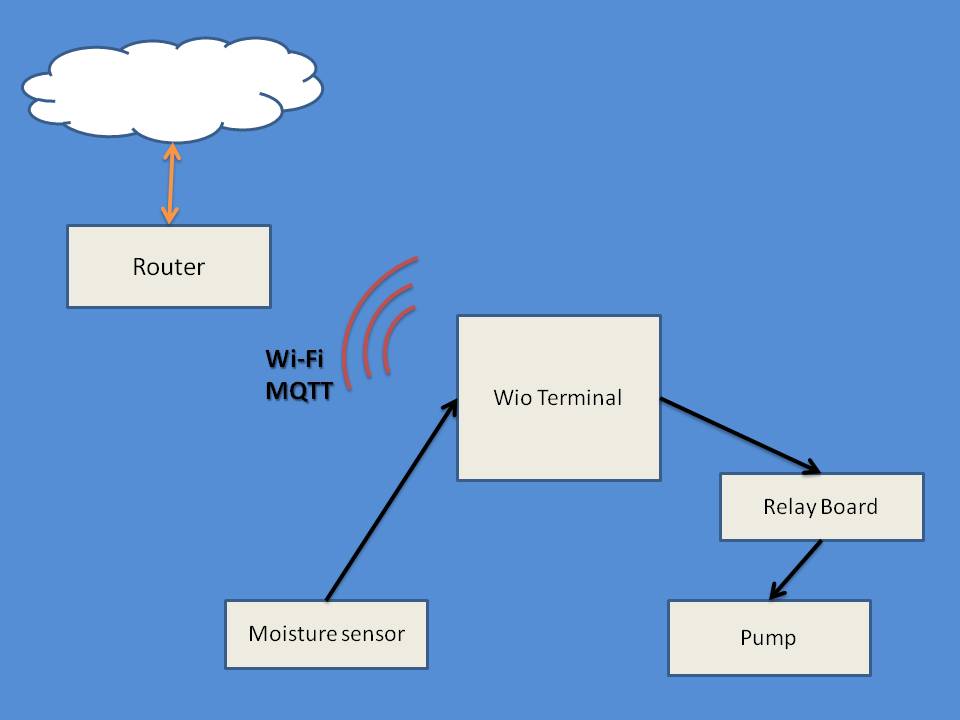
At the moment the system works perfectly. It monitors my home and, when the moisture sensor gets wet, the relay turns on the pump. Right now I am using a small pump that is commonly used in boats and it is powered at 12V through an external lead acid battery. This solution is optimal because, in case of flooding, the electrical system could switch off making it impossible to operate a 220V pump.
I hoped until the end for a postponement for the delivery of the project. The kit is really fantastic and I wasted a lot of time trying the too many possible solutions that came to my mind. I have had the opportunity to work with LoRa, even though the coverage in my part is still unstable. I also used other sensors that were part of a Seeed arduino kit.
It has been a fantastic experience and I will continue to work on this project to improve the user interface and to use it to manage other things as well, such as security in case of intrusion or fire.
Another thing I definitely want to try is the Grove Vision AI Module board which I couldn't even try due to lack of time but which I will dedicate the next few weeks to.
It was a great experience, thanks Seeed, thanks Hackster!


Comments
Please log in or sign up to comment.