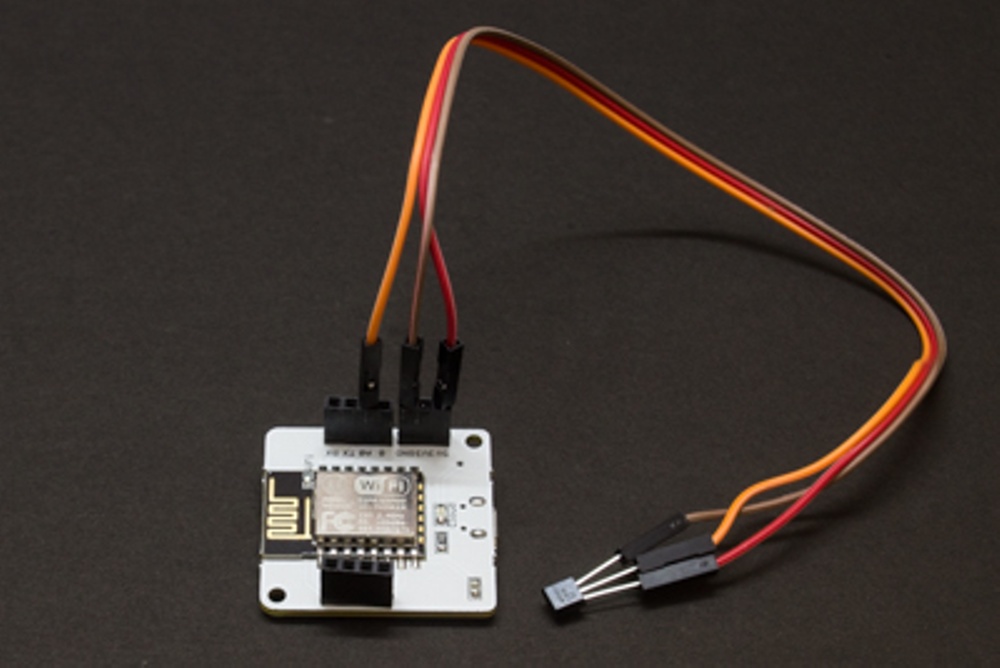
This project centers on real-time room temperature monitoring. It proactively sends SMS alerts when there is a significant fluctuation in temperature, or if the temperature dips below a predetermined minimum. Moreover, it leverages historical data to predict future temperature trends, empowering you to take informed actions.
Due to certain medical conditions, my physician has advised me against staying in rooms with temperatures below 33 degrees. Additionally, abrupt temperature changes can have harmful effects on my skin. Consequently, I conceived the idea of constructing an IoT device capable of alerting me as soon as any of the aforementioned situations occur. This device can also forecast forthcoming temperatures, allowing me to take preventive measures as needed.
WORKING OF THE PROJECTThe project mainly encompasses three functions:
- Dispatching alert SMS when the temperature falls below a particular minimum.
- Issuing alert SMS when a significant temperature change occurs.
- Predicting future temperatures utilizing Polynomial Regression.
SENDING ALERT SMS
Ubuntu, a Linux-based operating system, is widely used on servers.
On the other hand, Twilio is a third-party service providing SMS capabilities, enabling software developers to send and receive text messages programmatically via its web service APIs.
Upon gaining access to our Ubuntu (Linux) server, it's imperative to create a configuration file. This file will securely store all sensitive device and user keys, as demonstrated below.
SID = 'You can find SID in your Twilio Dashboard'
AUTH_TOKEN = 'You can find  on your Twilio Dashboard'
FROM_NUMBER = 'This is the no. generated by Twilio. You can find this on your Twilio Dashboard'
TO_NUMBER = 'This is your number. Make sure you are adding +91 in beginning'
API_KEY = 'This is your Bolt Cloud account API key'
DEVICE_ID = 'This is the ID of your Bolt device'
The initial four variables can be sourced from the Twilio dashboard, while the final two variables can be established as follows: Connect the Bolt device to the Bolt cloud to ascertain the DEVICE_ID and generate the API_KEY.
Next, create the main_code.py file. This file will house the primary code, which can be divided into the subsequent steps:
- Import all necessary libraries and the configuration file.
- Construct a function that provides high and low bounds.
- Retrieve the sensor value from the Bolt device.
- Validate the sensor value.
- Verify if the sensor value has dropped below the minimum and determine if an alert message is warranted.
- Determine whether the sensor value has breached the set bounds and evaluate if an alert is necessary.
- Pause for 10 seconds. Then, return to step 3.
PREDICTING TEMPERATURE
- Power up the device and establish a connection with the Bolt Cloud.
- Proceed to cloud.boltiot.com and initiate a new product creation. During this process, select 'Input Device' as the product type and 'GPIO' as the interface type.
- Upon product creation, locate and select the newly minted product, then click on the configure icon.
- In the 'Hardware' tab, activate the radio button adjacent to the A0 pin. Label this pin as 'temp' and confirm the configuration using the 'Save' icon.
- Transition to the 'Code' tab, designate the product code name as 'predict', and set the code type to 'js'.
- Compose the following code to graph the temperature data and execute the polynomial regression algorithm on this data. Save these product configurations afterward.
setChartLibrary('google-chart');
setChartTitle('Polynomial Regression');
setChartType('predictionGraph');
setAxisName('time_stamp','temp');
mul(0.0977);
plotChart('time_stamp','temp');- Navigate to the 'Products' tab, choose the created product, and then click the link icon. In the ensuing popup, select your Bolt device and finalize by clicking the 'Done' button.
- Select the 'Deploy Configuration' button, followed by the 'View this Device' icon to access the page you've configured.
- Allow approximately two hours for the device to transfer sufficient data points to the Cloud. Afterwards, hit the 'Predict' button to display the prediction graph derived from the Polynomial Regression algorithm.
SMS
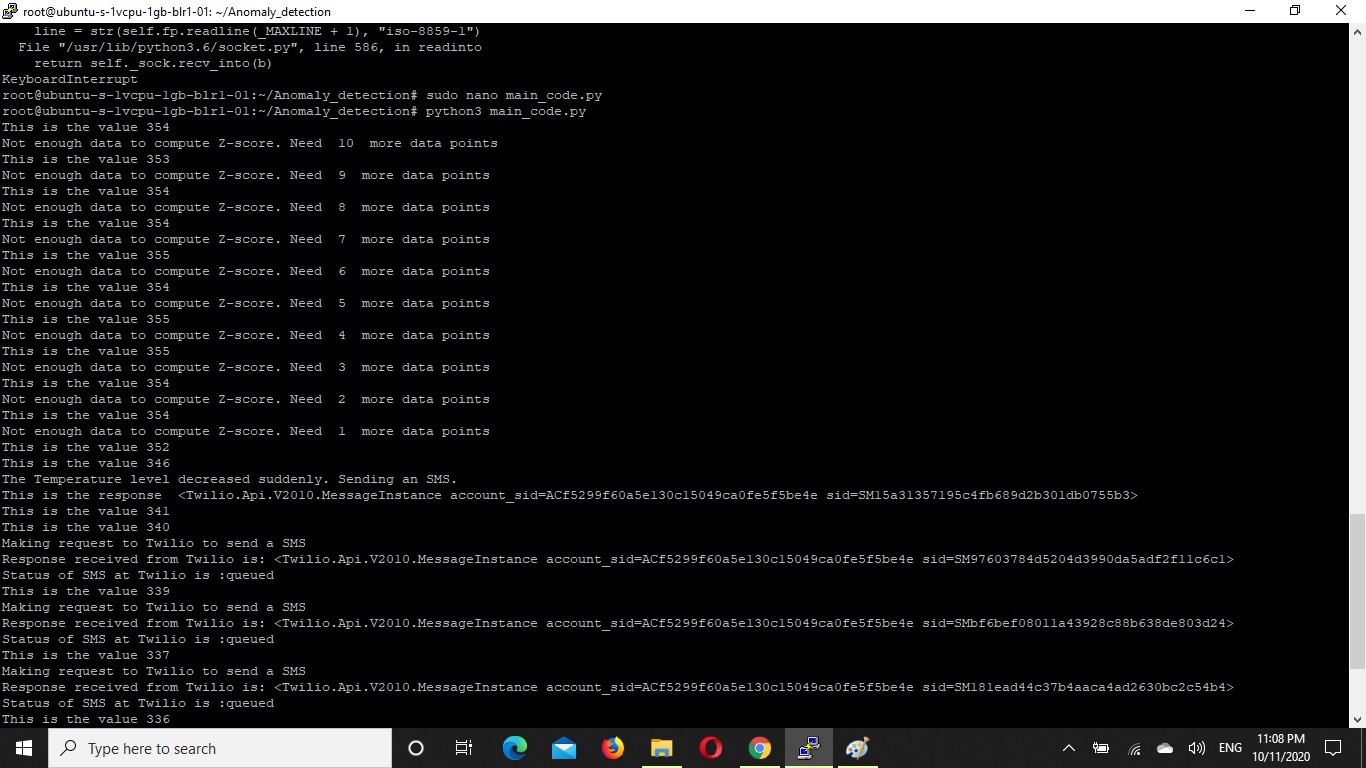
This is a screenshot capturing the console output, the result of the code execution.
The console initially displays "Not enough data to compute Z-score. Need 10 more data points," due to the frame value being set at 10. As soon as this frame is filled with 10 data points in the history list, the compute_bound function begins calculating the upper and lower thresholds.
Upon activating the AC and switching to I-cool mode, a significant temperature drop from 352 to 344 occurred, thereby triggering an anomaly detection. Consequently, an SMS alert was dispatched to my number stating, "Someone switched on the I-cool mode in AC."
The preset minimum temperature limit was set at 341. Hence, when the temperature fell below this limit, another SMS alert was sent to my number. This message read, "The current temperature sensor value is 340 and in Celsius, it's 33.203125."
PREDICTION
The image below depicts a prediction graph of time versus temperature, with four points forecasted via polynomial regression.
As evidenced in this graph, a sharp temperature drop occurred around 11:00 PM, corresponding with the alert SMS I received. The calculation for temperature is as follows: Temperature = (sensor_value * 100) / 1024.


.png?auto=compress%2Cformat&w=48&h=48&fit=fill&bg=ffffff)


Comments
Please log in or sign up to comment.