

Hardware components | ||||||
 |
| × | 1 | |||
 |
| × | 1 | |||
_ztBMuBhMHo.jpg?auto=compress%2Cformat&w=48&h=48&fit=fill&bg=ffffff) |
| × | 1 | |||
 |
| × | 1 | |||
Like an increasing number of the population, I have become infatuated with my plants during the COVID-19 lockdown. Unfortunately, the extra love and affection seem to have hindered one of my favorite plants from growing any new leaves this spring. Now a normal person would probably water the plant, put it in the sun, and wait - but here in the maker community, we love data and overengineered solutions. So, I grabbed some sensors from my old hardware box and got to work on making a plant monitor!
Originally, it was going to be a closed-loop, offline solution to water the plant when soil moisture dropped below some to be determined value - which eventually became more of a data collection tool to view sensor data on the local network. I had never worked with anything web related before so it was a good opportunity to take a simple idea from sensor to front end.
The project has three main parts - Arduino, middleware, and front-end. The exact code and file structure is on the linked GitHub repository, but I will try to outline the codebase below.
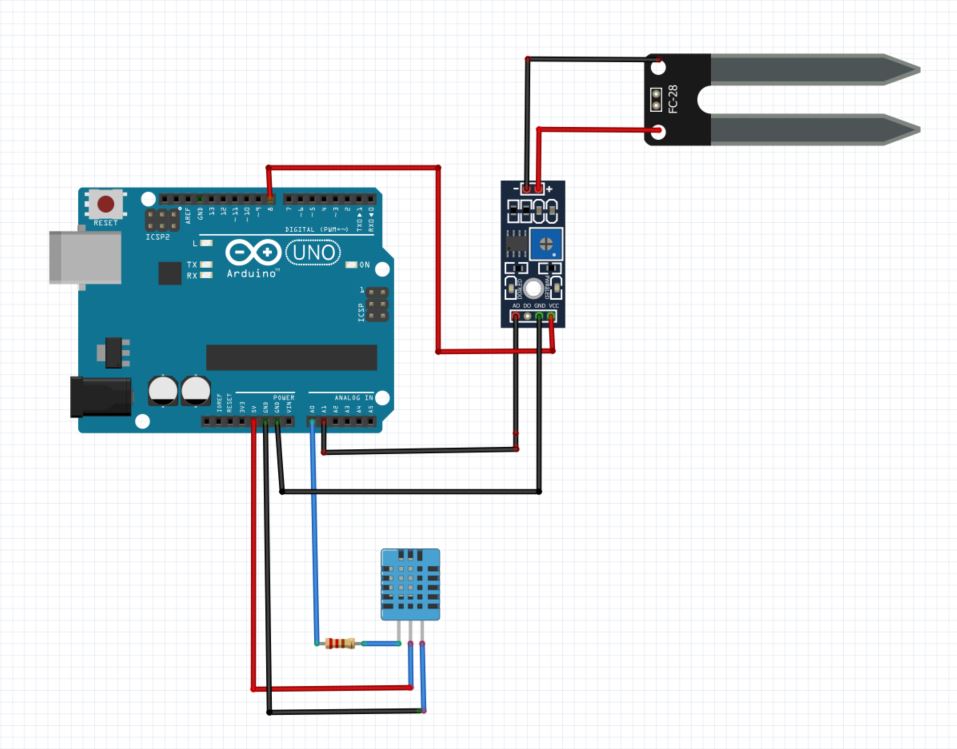
ArduinoThe Arduino part was the one I was most comfortable with, so it took about 15 minutes to get this up and running. The schematic for connecting up is shown below.
Your temperature sensor may have four pins instead of three, there will still be only three active connections but check the documentation for your particular sensor.
The DHT11 requires a GND and VCC provided by the Arduino, along with a data signal which the Arduino reads. The soil moisture sensor is a bit more tricky, it requires the same connections as the DHT11 (GND, VCC, signal) but, due to the sensor effectively setting up electrolysis, it has a very short lifespan. If you leave it constantly powered off a DC voltage, one of the legs (anode) will oxidize quickly and the sensor will start giving you bogus readings.
As a result, it is recommended to only power the moisture sensor when taking a reading. This is easily achieved by connecting the VCC signal to one of the Arduino's digital output pins, and sending a 'HIGH' pulse before you are expecting to take a reading. In my case it is being powered from pin 8.
The software to get the sensor readings is below. Make sure you have the DHT11 sensor library Installed (n.b I have not used the Adafruit circuit playground library, the library used is more lightweight.)
#include <dht.h>

const int DHT_pin = A0;
const int soil_moisture_pin = A1;
const int soil_moisture_trigger = 8;

int soil_moisture = 0;
unsigned long ms_per_s = 1000L;
unsigned long minutes = 60;
unsigned long sampling_time = minutes * ms_per_s * 60;

int dht_sig = 0;
int soil_moisture_sig = 0;
dht DHT;

void setup() {
    pinMode(soil_moisture_pin,INPUT);
    pinMode(soil_moisture_trigger,OUTPUT);
    Serial.begin(9600);
}

void loop() {
    dht_sig = DHT.read11(DHT_pin);
    digitalWrite(soil_moisture_trigger,HIGH);
    delay(10);
    soil_moisture_sig = analogRead(soil_moisture_pin);
    digitalWrite(soil_moisture_trigger,LOW);
    soil_moisture = map(soil_moisture_sig,168,0,0,100);
    Serial.print(DHT.temperature);
    Serial.print(DHT.humidity);
    Serial.print(soil_moisture);
    delay(sampling_time);
}In reality, you could leave the project here by adding a water pump alongside a control loop to automatically water your plants, but let us continue.
Now that the Arduino part is working well, we need to setup code on the Raspberry Pi to get this information. The Pis only real job is to get the data from the Arduino and push it onto the server that will be made in the next part. If you wanted to lower the cost of the project you could simply use a wifi compatible microcontroller - honestly, using a whole Raspberry Pi 3b+ is overkill for this.
Anyways, we will use PySerial to get the data from the Arduino. Note that the serial printing on the Arduino side is sending data via serial communication. Because of this, anything we print to the serial console in the Arduino code can be read by PySerial. Make sure your Arduino is plugged into one of the Pi's USB ports.
The first thing to do would be to make a main.py file and get PySerial by executing
sudo pip install pyserial
in the Pi's terminal. Let's begin coding.
Open up main.py and import pyserial - note that the module name is just 'serial'.
import serial
we can now set up the serial object using the line:
ser = serial.Serial("/dev/ttyACM0",9600)
The first argument is the COM port, and this might be different for you. 9600 is the baud rate which is also set on the Arduino side.
PySerial is a powerful package for anything serial related in Python - but we will only use the read function. We will be sending three data values in every packet from the Arduino to the Raspberry pi - a temperature which is the first 5 bytes, humidity which is the next 5 bytes, and soil moisture which is the last two bytes. This can be done using the
ser.read()
function. We also need to decode the incoming bytes, so your code would look as follows:
import serial

ser = serial.Serial("/dev/ttyACM0",9600)

temperature_r = ser.read(5).decode('utf-8')
humidity_r = ser.read(5).decode('utf-8')
soil_m_r = ser.read(2).decode('utf-8')
There are a few things to note about ser.read(). Firstly, it is blocking, which means that no other code will be executed until something is read. We will use this to our advantage when waiting for data from the Arudino but, it is a good thing to be aware of if the software is not running as expected.
Now that we have got data from the sensors to the Raspberry Pi, its time to put it on the web.
FlaskFlask is a microweb framework for Python which can be used to make a server. Flask is not recommended to be used as a production server - and it also says this on their official documentation so think again if you are going to commercialize a project based on it.
To set up the server we need to make a flask app. First, we need to make a few imports and initialize a Flask object:
from flask import Flask, jsonify,render_template,request

app = Flask(__name__)

if __name__ == '__main__':
    app.run()
now the app is ready for us to add some routes into it. let us start by rendering the page when we load it.
from flask import Flask, jsonify,render_template,request

app = Flask(__name__)

@app.route("/")
def index():
    return render_template('index.html')

if __name__ == '__main__':
    app.run()
In this case, index.html Is the HTML page which will load. The functionality for this will be driven by Javascript.
You can provide the app.run() with a few arguments, in my case I specified the host and port to run on the IP of the Raspberry Pi.
app.run(host = '0.0.0.0', port = 5000)We have the three parts of our system running: Arduino, which is the data collection unit, Pyserial which grabs the Arduino data, and the flask server which will push the data to a local network.
Let me just review the flow of the code before we start integrating. The Arduino will be collecting data throughout the day, and when someone logs onto the local network, all of that data will be plotted. To do this, we need to be storing data for long periods until a request is active. We can use a thread to do this. In this thread all we will be doing is collecting the data in a while loop. As the read function is blocking, the loop will be stuck until the Arduino sends any data in the first place. The thread will be defined in a separate function, and send data to the flask app via a queue. The code will now look like this :
from flask import Flask, jsonify,render_template,request
import threading, queue
import serial
from datetime import datetime

ser = serial.Serial("/dev/ttyACM0",9600)
app = Flask(__name__)
q = queue.Queue()

temperature = []
humidity = []
soil_moisture = []
time_ax = []

def data_collection():
    while(1):
    #set variables
        i = 0
        #read is blocking so waits till next packet of data is sent
            temperature_r = ser.read(5).decode('utf-8')
        humidity_r = ser.read(5).decode('utf-8')
        soil_m_r = ser.read(2).decode('utf-8')
        time_of_reading = datetime.now() #this will be the x axis
        #put data in queue
        q.put(temperature_r)
        q.put(humidity_r)
        q.put(soil_m_r)
        q.put(time_of_reading.strftime("%H:%M"))


@app.route("/")
def index():
    return render_template('index.html')

if __name__ == '__main__':
    x = threading.Thread(target=data_collection)
    x.start()
    app.run(host = '0.0.0.0', port = 5000)
Now we can finally define a second route which will get the data from the data collection thread, and send it to the front end. The get and put methods in the Queue module are also blocking - so make sure to have a look at the documentation if things are not working.
from flask import Flask, jsonify,render_template,request
import threading, queue
import serial
from datetime import datetime

ser = serial.Serial("/dev/ttyACM0",9600)
app = Flask(__name__)
q = queue.Queue()

temperature = []
humidity = []
soil_moisture = []
time_ax = []

def data_collection():
    while(1):
    #set variables
        i = 0
        #read is blocking so waits till next packet of data is sent
            temperature_r = ser.read(5).decode('utf-8')
        humidity_r = ser.read(5).decode('utf-8')
        soil_m_r = ser.read(2).decode('utf-8')
        time_of_reading = datetime.now() #this will be the x axis
        #put data in queue
        q.put(temperature_r)
        q.put(humidity_r)
        q.put(soil_m_r)
        q.put(time_of_reading.strftime("%H:%M"))

@app.route("/update", methods = ['GET'])
def update_chart():
    while not q.empty():
        temperature.append(q.get())
        humidity.append(q.get())
        soil_moisture.append(q.get())
        time_ax.append(q.get())
    return jsonify(results = [temperature,humidity,soil_moisture,time_ax])

@app.route("/")
def index():
    return render_template('index.html')

if __name__ == '__main__':
    x = threading.Thread(target=data_collection)
    x.start()
    app.run(host = '0.0.0.0', port = 5000)
And that is it for the Python side.
JavascriptAll the backend is ready - we can use chartjs to plot the data using Javascript. Setup the chartjs environment first. I have used the following lines of code:
var ctx = $("#temperature_chart");
console.log("test");
var temperature_chart = new Chart(ctx, {
    type: 'line',
    data: {
        labels: [],
        datasets : [
            {
                label: 'temperature',
                data: [temperature],
                borderColor: [
                    '#060666',
                    ],
                borderWidth: 3,
                fill: false,
                yAxisID: "temperature"
            },
            {
                label: 'Humidity',
                data: [humidity],
                borderColor: [
                    '#d6c73e'
                    ],
                fill: false,
                yAxisID: "humidity"
            },
            {
                label: 'Soil Moisture',
                data: [soil_moisture],
                borderColor: [
                    '#7fced4'
                ],
                fill: false,
                yAxisID: "humidity"
            }
        ]
    },
    options: {
        responsive: false,
        scales:{
            xAxes: [ {
                //type: 'time',
                display: true,
                scaleLabel : {
                    display: true,
                    labelString: 'Time (s)'
                    },
                ticks: {
                    autoSkip: true,
                    maxTicksLimit: 12
                }
                }],
            yAxes: [ {
                id: "temperature",
                display: true,
                position: 'left',
                ticks: {
                    suggestedMin: 15,
                    suggestedMax: 30
                },
                scaleLabel : {
                    display: true,
                    labelString: 'Temperature (C)'
                    }
                },
                {
                id: "humidity",
                display: true,
                position: 'right',
                ticks: {
                    suggestedMin: 0,
                    suggestedMax: 100
                },
                scaleLabel : {
                    display: true,
                    labelString: 'Percentage Humidity'
                    }
                    }]
                }
    }
});
Finally, to get the data from the Flask backend, we use the following lines of code:
var x = 0;
var temperature = 0;
var humidity = 0;
var soil_moisture = 0;

var updated_data  = $.get('/update');
updated_data.done(function(results){
    temperature = results.results[0];
    humidity = results.results[1];
    soil_moisture = results.results[2];
    x = results.results[3];
    console.log(temperature);
    console.log(humidity);
    console.log(soil_moisture);
    temperature_chart.data.datasets[0].data = temperature;
    temperature_chart.data.datasets[1].data = humidity;
    temperature_chart.data.datasets[2].data = soil_moisture;
    temperature_chart.data.labels = x;
    temperature_chart.update();
});
This calls the update route specified in the Python script when someone goes onto the webpage.
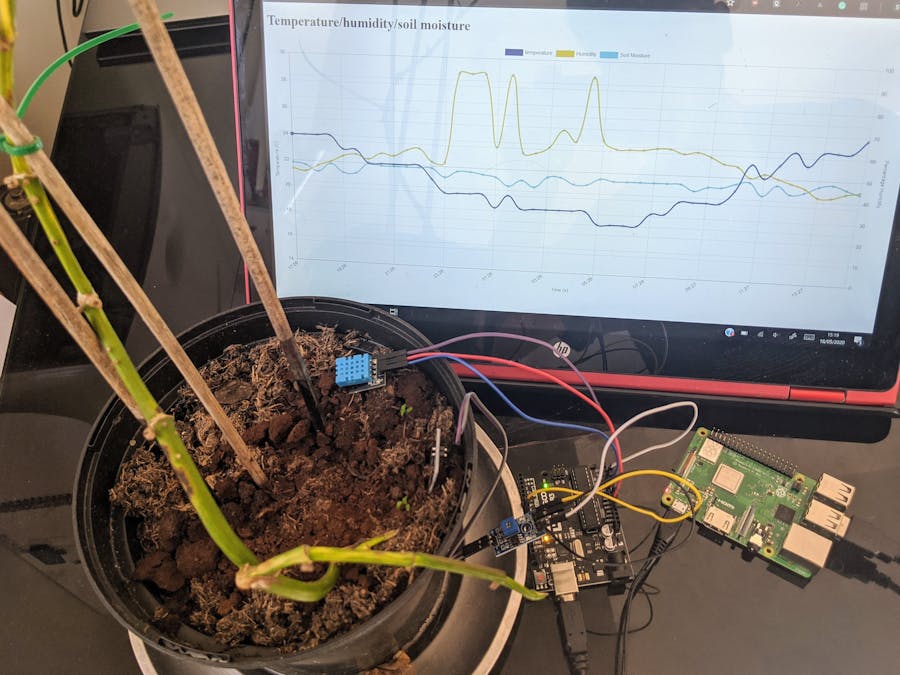
Results
ResultsAs you can see, the final result is a timestamped graph with two y axes. The project overall worked quite well, and over more days I was able to see clear periodicity of the temperature and humidity, along with a linearly decreasing trend of the soil moisture as expected! This data is completely raw, and there are several ways this project could be made better
Possible Next StepsThe sensors in this project can be swapped out for any other sensor compatible with Arduino or Raspberry Pi. Eventually you may want to do some actual processing instead of plotting raw data - for this reason it may be easier to send all the data to a csv constantly, instead of putting it into a queue to be retrieved. This means the data is available to you in the case that your wifi cuts out, or if the system stops responding.
You can also interface a water pump or some other actuator, that can be controlled from the local network - just add another route if a button is pressed on the front end.
Chartjs is not really meant for real-time plotting, but you can easily make it update every few seconds by having another route which polls for data. In the javascript you can then retrieve this data and update the chart within a setInterval() function.
If you have any questions feel free to reach out. I will try to answer to the best of my knowledge!


_3u05Tpwasz.png?auto=compress%2Cformat&w=40&h=40&fit=fillmax&bg=fff&dpr=2)
Comments
Please log in or sign up to comment.