


Hardware components | ||||||
 |
| × | 1 | |||
 |
| × | 1 | |||
 |
| × | 1 | |||
Software apps and online services | ||||||
 |
| |||||
| ||||||
In this project, we will build a system so that we could monitor the light our plants get and send the data to Bolt Cloud.
At the end of the project, we will be able to collect the values indicating intensity the of the light and plot them over a line graph.
Let's get started and build our system
Before you move to the Step 1, make sure that your Bolt WiFi Module is connected to Bolt Cloud and the green LED onBolt Moduleis Glowing.
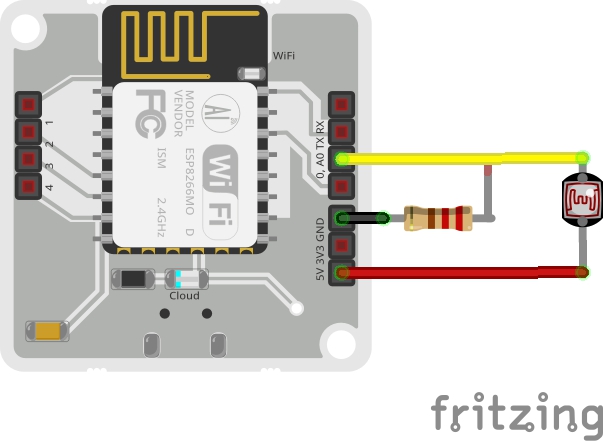
Step 1: Building the circuit1. Make sure you have not powered on your Bolt Module while connecting the circuit. This will ensure that in case we make any mistake, it will not short circuit your device. Switch off the power if it is connected.
2. Connect one end of the LDR to the A0 (analog) pin of the Bolt device and other ends of the LDR to the 5V pin of the Bolt as shown in the image below.
3. Connect the 10K ohm resistor between the GND and A0 pin of the Bolt so that LDR and the resistor form a series connection.
NOTE: Make sure connections are made properly. Ensure that there is no short-circuit inthe connections.
4. Now your circuit is ready. You may power on your device.
Step 2: Connect your Bolt device to the Bolt CloudTo check if it is connected to Cloud, have a look at the green coloured Cloud LED on the Bolt WiFi module. It should be glowing.
Just follow these simple steps to visualise the collected Light Intensity data:
1. Login into cloud.boltiot.com and click on the 'Product' tab.
Go to Product
2. Create a new product for your light monitoring system. Products are created once and can be used for multiple Bolt devices. This ensures scalability for your IoT products you build on Bolt.
3. Next, we need to 'Configure our product'. For this click on the Configure Product icon.
Now choose the hardware pins which you plan to use for this project. Since LDR is an Analog Sensor and Bolt WiFi Module has only one Analogue pin, we have to choose only the A0 pin.
Now give a suitable variable name to the pin value. By this, you will create a variable which will store the sensor value as it is received. We can then use this value in our project.
With this, you have completed your hardware configuration. Save your configuration and move to the code tab.
4. Click on the 'Code' tab, and then click on the 'Import code' button to generate and import a new code.
Here you will choose the option of Line Graph since we want to plot the line graph for our sensor value. However, in case you want to choose any other type of graph then you could do so.
The code tells the Bolt Cloud, how to plot the sensor data for visual representation.
Now let me explain each line of the code so that you could make suitable changes as you wish.
setChartLibrery function sets the data visualisation library you would use. The most commonly used one on Bolt Cloud is the Google Library. However, you could use any other JavaScript or HTML code here to visualise the data.
setChartTitle function sets the title of the chart/graph. Give a suitable name for your graph here which will be shown in the heading of the page. This is different from the name of the code file.
setChartType function is where you choose which type of chart you want i.e. Line Graph, Bar Graph etc.
setAxisName will set the name for the X Axis and Y Axis
plotChart is where you choose which variable you want to choose in your chart.
5. Give a name to your code and save the configurations.
6. Link Bolt with the 'Light_monitoring' product that you created. Linking allows your Bolt to access the configurations defined for a product.
7. Deploy the code to your Bolt. Deploying means to transfer the instructions and configuration to the Bolt device.
Deploy code
8. See the output on a plot. You can vary the light intensity by placing the circuit under the desk or glowing a torch on the LDR sensor.
See output
Output PlotThis project is based on the principle that whenever the light falling on the sensor changes, the resistance of sensor changes which is then converted into a change in voltage. The ADC pin on Bolt WiFi Module converted this analog voltage level into digital values which are shown on the graphs.
We connect the LDR between 5v pin and the analog input pin (A0), so that when light intensity increases, the resistance of LDR decreases so the voltage across the LDR decreases and as a result, the voltage on the analog input pin increases.
This means that as the light intensity increases, the voltage on the analog input pin also increases. The Bolt then converts that the voltage a 10 bit (10 places in binary number system) digital value that varies from 0-1024 (0 to 2 raised to 10).
This digital data is then sent to the cloud where it is plotted for visual representation.


Comments
Please log in or sign up to comment.