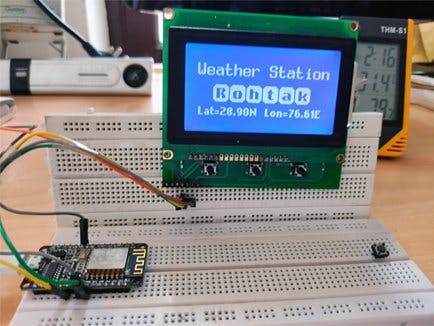
When it comes to making a weather reporting device, sensors are the first to come to mind. There are lots of such weather projects available that use a separate sensor for each weather parameter. You need temperature and humidity sensors for measuring ambient temperature and humidity in the air around us, pressure for measuring atmospheric pressure. It is fine if you need to see two, three-parameter, but what about measuring near a dozen of weather parameters like wind speed, wind gust, visibility, and much more. That would not only increase the cost per sensor but would also make the project messy hooking these numbers of sensors and bulky in the form factor.
So Internet Weather Station reads 13 different weather parameters, comes as an inexpensive solution, and without compromising the number of parameters you wish to read. Let us see the weather around us making this project step by step!
Video of the Internet Weather Station
What's the idea beneath?
The idea is a cakewalk! we make use of an open weather API (Application Programming Interface) to fetch the data from the internet, process it, and show it on the display. But mind you the idea I have told you is just the tip of the iceberg! when we really implement it. I am not scaring you guys rather encouraging you to see beneath the hardware and software code how things work!!
Here are core playingdevices*
- NodeMCU
- GLCD
*for the complete list see the components column.
NodeMCU is an open-source platform based on the low-cost Wi-Fi MCU ESP-12E module of the ESP8266 by Espessif. There are two versions of NodeMCU as version 0.9 and 1.0 where version 0.9 contains ESP-12 and 1.0 contains ESP-12E where E stands for enhanced. NodeMCU has a full stack of Wi-Fi TCP/IP, over ESP12-E, that all allow it to connect to a Wi-Fi network and establish TCP/IP connection to access the internet
GLCD is a graphical version popular character LCD. It can display graphic images glyph and animation with text messages. It has a resolution of 128x64 pixels, 128 rows, and 64 columns. This one is based on display controller ST7920 by 'Sitronix' so generally known by ST7920 number, however, it is available with different numbers like LM3033 by 'Topway'. There are more display controllers available in the market please check your display controller referring to its datasheet.
Beneath the deep fathom!
It is expected by this time you would have acquired components, read the schematic, and realized on the breadboard. So it's time to go into the fathom of beneath!
A little bit about hardware
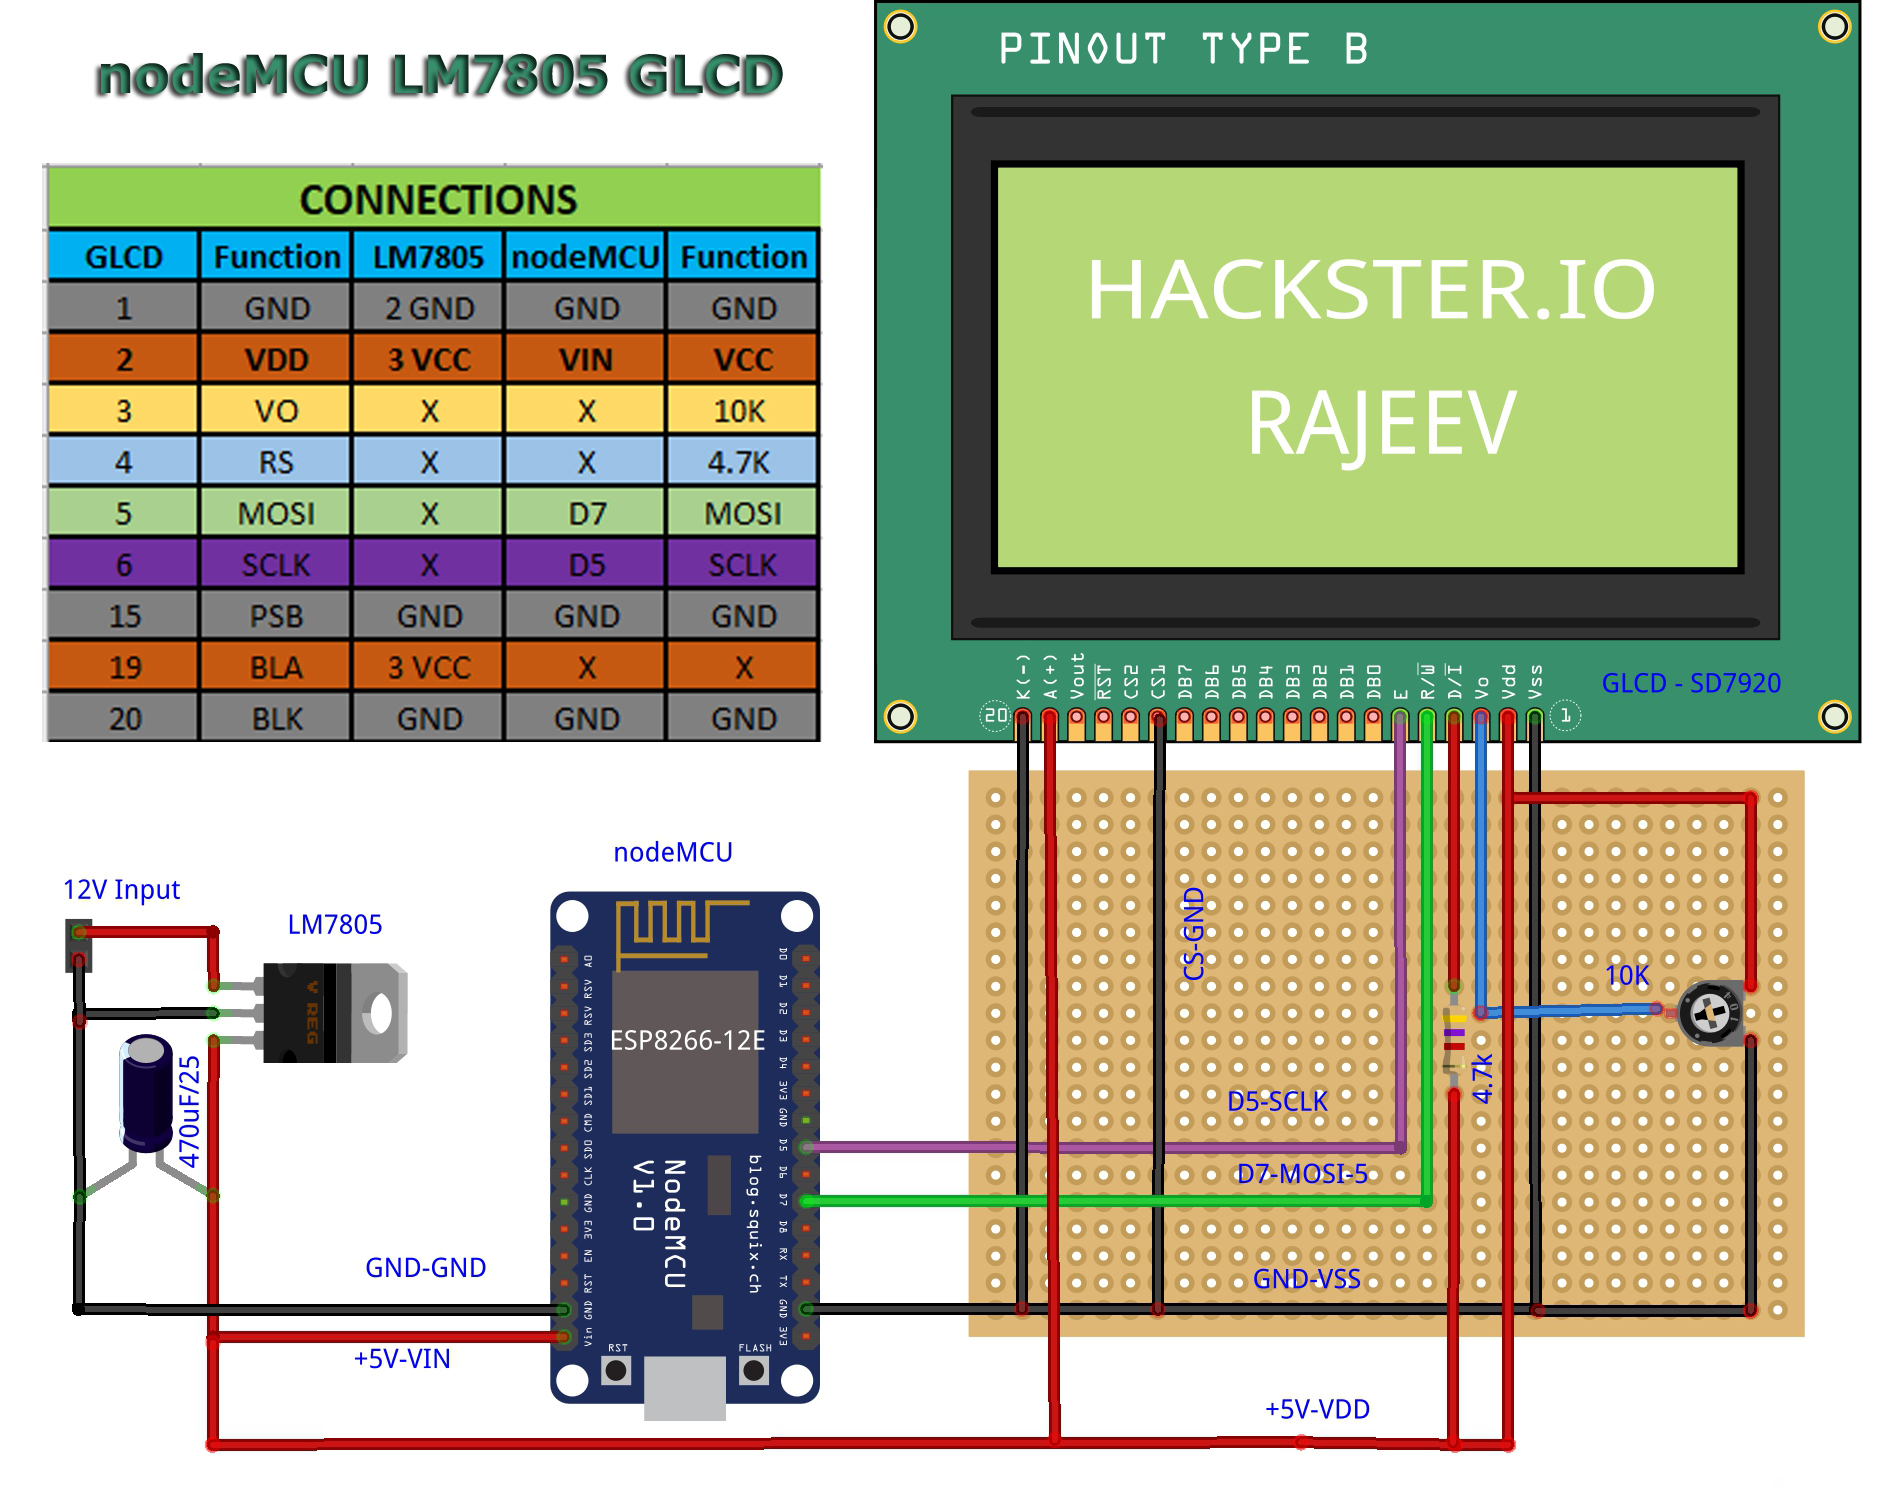
The NodeMCU, the Master, uses SPI protocol to communicate with GLCD configured as a slave device. It has 20 pins. The first and second pins of GLCD and Ground and VDD respectively. Third pin is VO and is connected to the wiper of the10K ohm trimmer to adjust the contrast of the screen. The fourth pin is RS, register select, to select between Instruction Register or Data Register. It is tied high through a 4.7K ohm resistor. The fifth pin in SPI mode acts as Master Out Slave In Slave Out, MOSI, hooked to D7 port of the NodeMCU, over this data flows from master to the slave GLCD. Next pin, 6, is Serial Clock pin, SCLK connected to D7 pin of the MCU. Pin 15 CS1, Chip Select 1, tied to ground. 19th and 20th pins belong to the positive and negative of the backlight of the display connected to the respective polarity of the power supply VDD and GND.
*Your display may have different display controller kindy check its datasheet before making connections.
We have used an external power supply built around the famous LM7805 5Volt regulator, to power GLCD. VO pin of the NodeMCU is capable of providing 5Volt but it is not capable of feeding a hefty current of 70mA demanded by hungry GLCD. Please refer to the schematic for more details.
Much-more about software
First off, you have to get your open weather API by signing up here https://openweathermap.org
Add/download the following libraries in your Arduino IDE.
- Arduino.h
- U8g2lib.h
- ESP8266WiFi.h
- ESP8266HTTPClient.h
- WiFiClient.h
- ArduinoJson.h
- SPI.h
- Timezone.h
Enter your Wi-Fi credentials, city name, and API key where mentioned in the code. If you are having difficulty with the city name or API key please see open-weather-org documentation.
In the beginning, there are macro definitions to ease out taking decisions in if/else or switch/case statements.
Global variables have been declared to have their accessibility in every code block we don't want to lose our precious data between function calls.
This is a constructor which initializes the necessary objects and is declared in the 'U8g2lib.h' There are different constructor call available in this library find out which one is compatible with your display if this doesn't work.
https://github.com/olikraus/u8g2/wiki/u8g2setupcpp
U8G2_ST7920_128X64_F_SW_SPI u8g2(U8G2_R0, 14, 13, 15, U8X8_PIN_NONE)This graphics library version 2.0 for different embedded devices is used to generate different fonts and render graphics like glyphs and animation. There is much to say about this beautiful library so please see this reference manual at GitHub.
https://github.com/olikraus/u8g2
After successful connection with the WiFi router or hotspot whichever you are using assigned IP address is printed on the serial monitor.
Serial.println(WiFi.localIP());Once the connection is established we jump into the loop block of the code. First, drawRohtak( ); function is called which is our welcome screen. First, we set the font by calling this inbuilt function. Inside round braces that's the name of the font I have chosen you can choose which one you like here is the direct link to the GitHub page:
https://github.com/olikraus/u8g2/wiki/fntgrp#font-groups
u8g2.setFont(u8g2_font_8x13B_mr);This places the typing cursor on the desired pixel position in x, y coordinates.
u8g2.setCursor(6, 20)This writes the text on the position set by the previous function.
u8g2.print(F("Weather Station"));After a set delay, 'get-weather' function is called this is where API comes into the business and we get our data bytes.
getWeatherData();in this get weather function, we will be using the 'WiFi.h' library.
This sends a request to the server and port given in the arguments. If the request is successful, TRUE, then 'if' block code is executed otherwise we get out of the function back to the main loop.
client.connect(servername, 80)This piece of code sends 'HTTP GET' request to the connected server to request data. Please keep in mind as per 'open-weather-org' website API request not to send more than once in 10 minutes else your API could be banned for sending flooding requests to their server.
client.println("GET /data/2.5/weather?q=" + city + "," + countryCode + "&units=metric&APPID=" + openWeatherMapApiKey);If 'HTTP GET' request is successful we get our data into the 'result' string which is printed on the 'serial monitor' for debugging purposes.
The data we have just received is in JSON format, we use the 'ArduinoJson' library to parse it into objects those are store in the 'root' array. If in any case this parsing fails you get an error message 'parse Object() fails'.
JsonObject &root = json_buf.parseObject(jsonArray);If everything has fallen in the right place we should be happy to see our data received from a remote server. All the parameters are first printed on the serial monitor and then to our GLCD.
Now, we jump back to our main loop thanks to stack for holding the address for time being!.
Here we take decisions based on the weather description and appropriate 'gylph' is displayed with a scrolling message. Like one to mention here:
else if (weatherr == "Rain")
    draw("It's raining cats and dogs.", RAIN, temperaturee);
This further calls to draw function and begins a chain of function call one from another to do the specific job.
The draw function calls to drawWeather and drawScrollingString functions. Here drawWeatherSymbol function is called. This function first sets the desired font and then draws glyph to indicate the specific weather condition like this call indicates the sunrise time and a brighten sun 'glyph' is displayed on the screen.
//sunrise
void drawWeatherSymbol_sr(u8g2_uint_t x, u8g2_uint_t y, uint8_t symbol)
{
  u8g2.setFont(u8g2_font_open_iconic_weather_6x_t);
  u8g2.drawGlyph(0, 48, 69);
}
In drawGlyph third argument is encoding changing the number you can change the glyph graphics, see U8g2 library reference manual.
You would see one timezone conversion function named 'UTC_Local( )'. The time we get in our JSON data is not in human-readable format but it is a UNIX Time Stamp. What? I will write here a little brief about it, refer to the web for further reading and understanding. Actually, UNIX Time Stamp is the number of seconds elapsed so far, in our case when we made our API call to get data, since January 1, 1970 midnight. It is when we count 0000000000 seconds (10-digits). So, in our case, we get 1627825526 seconds that need to be converted to hours, minutes, and seconds. 'UTC_Local( )' return us time in human-friendly format, for above time stamp it will return 19:15. This time stamp is popularly known as Unix epoch. One thing to note down is that I have written this function to convert UTC, Coordinated Universal Time, to IST, Indian Standard Time which is +5:30 hours ahead of UTC.
So, for your country, you have to find out how many hours or minutes your local standard time lags or leads UTC. For example, Central Europe Time is UTC + 02:00 so you need to add 2*60=120 minutes see below the third argument.
TimeChangeRule mySTD = {"CET", Second, Sun, Mar, 2, 200}; // Standard time = UTC +2:00Is anything left? Yes?
Credits
Thank you so much for reading or making my project. And credit goes to my kids daughter Hridya (means heart) and Ayansh (means the God particle) for not blowing off my laptop amid writing this project, however, I can see some caricatures on the top of it drawn with a red crayon!
So, I hope you would like my project and its working explanation. If you face any issue or bug kindly mention it in the comment box below.
Goodbye for now!!
Rajeev Mehndiratta


Comments
Please log in or sign up to comment.