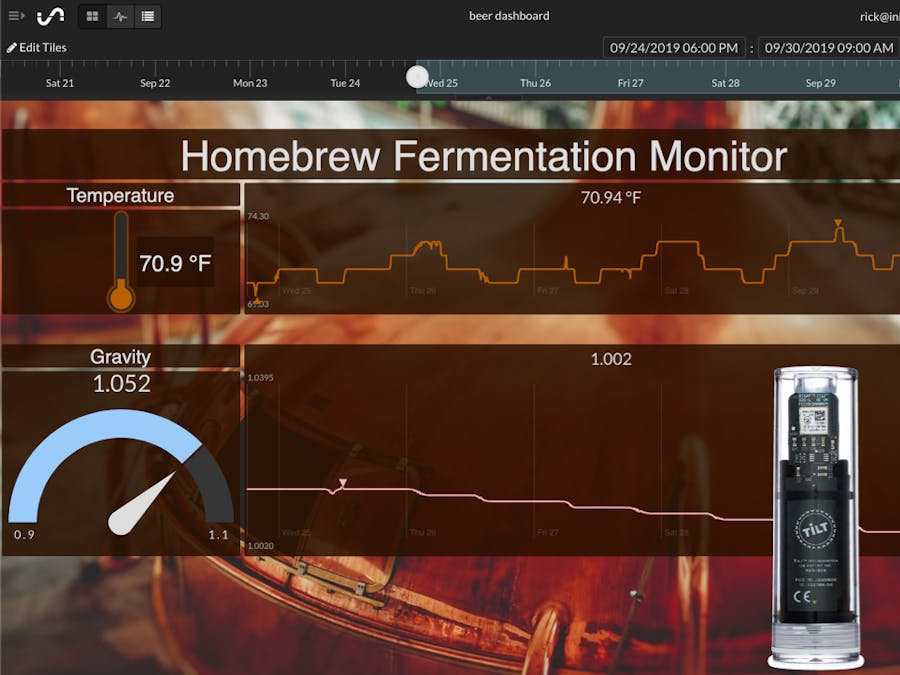
The Tilt sensor mobile software allows users to wirelessly read the Tilt sensor through your phone. However, you have to be within BLE transmission distance from the sensor to do this. Our objective is to read and decode the BLE advertisements coming from the Tilt sensor into a connected Raspberry Pi and transmit the data to an IoT dashboard. With this setup you can check on your fermentation from anywhere. If you need an Initial State account register free here.
Get Raspberry Pi ReadyMake sure you Pi is powered up and connected to the internet. You will need to know the IP address, which you can lookup on the device itself or through your router. Learn more here.
1. SSH into your piWindows: Follow the instructions for SSH using Windows
Mac/Linux: SSH is native so just open a terminal and follow the instructions for SSH from Mac/Linux
2. Install ISStreamerThe ISStreamer enables one-line python data streaming to a real-time dashboard hosted in Initial State. Instructions to install python support for Initial State IoT dashboards is on the Initial State Python Streamer Github Repo
3. Install BluezBluez is the full bluetooth system for Linux. There are some great installation instructions in the Adafruit knowledgebase for Bluez installation. Make sure you complete the part that allows interfacing with BLE.
4. Install PyBluez & Bluetooth Header FilesPyBluez wraps Bluez for python and the second command installs the Bluetooth development header files.
sudo pip install pybluez\[ble\]
sudo apt-get install bluetooth libbluetooth-devIf you are able to use the bluetoothctl console to scan for BLE devices, everything should be working. See below.
pi@raspberrypi:~ $ bluetoothctl
[bluetooth]# set-scan-filter-clear
SetDiscoveryFilter success
[bluetooth]# scan on
Discovery started
[CHG] Controller B8:27:EB:22:57:E0 Discovering: yes
[CHG] Device F1:55:90:65:29:DC RSSI: -55
[CHG] Device F1:55:90:65:29:DC ServiceData Value: 0x00
[CHG] Device F1:55:90:65:29:DC ServiceData Value: 0x09
[bluetooth]# scan offWe are going to start by using a repo made by Atlefren. This code executes a BLE scan and decodes the BLE transmission into a temp and gravity measurement. We will adjust the code to add Initial State streaming.
1. Create a new folder and clone the base repo.git clone https://github.com/atlefren/pytilt.git- Remove References to Sender() - There is also a reference in the FOR loop, which will be replaced with a new code block in a step below. We will be using Initial State Python streamer to send the data to the cloud.
#REMOVE LINE --- from sender import Sender
#REMOVE LINE --- sender = Sender()- Import Initial State Streamer at the top of the code with the other imports. As long as you install the ISStreamer this line of code will work properly.
#ADD LINE AT TOP OF CODE ---
from ISStreamer.Streamer import Streamer- Initialize the Initial State streamer using this code. Place it as the first line in the primary function - def monitor_tilt(): Of course, you should replace the placeholders myBucketKey and myAccessKey with your keys. If you don't yet know about this, take a minute and familiarize yourself with Initial State Buckets and data streaming. If you don't have an account create a free one here.
streamer = Streamer(bucket_name="MY Beer Dashboard", bucket_key="myBucketKey", access_key="myAccessKey"- Initialize some array buffers for local data storage and averaging. Add the following code after the streamer initialization. We'll collect some value and average them before sending.
temperature_buffer = []
gravity_buffer = []- Delete code in the FOR LOOP identified below
#REMOVE CODE IN THIS FOR LOOP ---
for beacon in beacons:- Add the following code into the FOR Loop after the line - for beacon in beacons:
if beacon['uuid'] in TILTS.keys():
   temperature_buffer.append(beacon['major'])
   gravity_buffer.append(beacon['minor'])
if len(temperature_buffer) >= 10:
   temperature_average = round(float(sum(temperature_buffer))/float(len(temperature_buffer)),3)
   gravity_average = round(float(sum(gravity_buffer))/float(len(gravity_buffer)),3)
   print "Temp Avg:"
   print temperature_average
   print "Gravity Avg:"
   print gravity_average
   streamer.log("Temperature", temperature_average)
   streamer.log("Gravity", gravity_average)
   del temperature_buffer[:]
del gravity_buffer[:]Below is the finished code for pytilt.py
import sys
import datetime
import time
import bluetooth._bluetooth as bluez
from ISStreamer.Streamer import Streamer
import blescan

TILTS = {
'a495bb10c5b14b44b5121370f02d74de': 'Red',
'a495bb20c5b14b44b5121370f02d74de': 'Green',
'a495bb30c5b14b44b5121370f02d74de': 'Black',
'a495bb40c5b14b44b5121370f02d74de': 'Purple',
'a495bb50c5b14b44b5121370f02d74de': 'Orange',
'a495bb60c5b14b44b5121370f02d74de': 'Blue',
'a495bb70c5b14b44b5121370f02d74de': 'Yellow',
'a495bb80c5b14b44b5121370f02d74de': 'Pink',
}

def distinct(objects):
   seen = set()
   unique = []
   for obj in objects:
   if obj['uuid'] not in seen:
      unique.append(obj)
      seen.add(obj['uuid'])
   return unique

def to_celsius(fahrenheit):
   return round((fahrenheit - 32.0) / 1.8, 2)

def monitor_tilt():
   streamer = Streamer(bucket_name="Beer Dashboard", bucket_key="Q6VBB6453YGA", access_key="ist_RGs3sp9k6OsM77HqeYBLMysALfrEJ4et")
   temperature_buffer = []
   gravity_buffer = []
   while True:
   beacons = distinct(blescan.parse_events(sock, 100))
   for beacon in beacons:
      if beacon['uuid'] in TILTS.keys():
         temperature_buffer.append(beacon['major'])
         gravity_buffer.append(beacon['minor'])
      if len(temperature_buffer) >= 10:
         temperature_average = round(float(sum(temperature_buffer))/float(len(temperature_buffer)),3)
         gravity_average = round(float(sum(gravity_buffer))/float(len(gravity_buffer)),3)
         print "Temp Avg:"
         print temperature_average
         print "Gravity Avg:"
         print gravity_average
         streamer.log("Temperature", temperature_average)
         streamer.log("Gravity", gravity_average)
         del temperature_buffer[:]
         del gravity_buffer[:]
       time.sleep(1)

if __name__ == '__main__':
   dev_id = 0
   try:
      sock = bluez.hci_open_dev(dev_id)
      print('Starting pytilt logger')
   except:
      print('error accessing bluetooth device...')
      sys.exit(1)
   blescan.hci_le_set_scan_parameters(sock)
   blescan.hci_enable_le_scan(sock)
monitor_tilt()In order to run the code as a test, make sure things are working.
sudo python pytilt.pyIt is a good idea to make the code more fault-tolerant by running the code on startup. This way if your Pi restarts or crashes, it will automatically start again, and keep filling up your dashboard.
- edit pytilt.service, remove both environment lines (they are not used when we removed the Sender() functionality from the base repo.
- copy pytilt.service to /lib/systemd/system/
- sudo chmod 644 /lib/systemd/system/pytilt.service
- sudo systemctl daemon-reload
- sudo systemctl enable pytilt.service
- sudo reboot
For my dashboard, I created a line graph out of the temperature and gravity. I also added some extra gauges to easily read the instantaneous values. In addition, you can add a trigger to get a text when the gravity gets to a certain point.
If you see two dashboards, you've had too much.


Comments
Please log in or sign up to comment.