


Software apps and online services | ||||||
| ||||||
 |
| |||||
 |
| |||||
Graphs, Line Charts, Pie Charts etc. are an interactive way to visualize and analyse the Sensor data. In this blog we will be featuring the use of Google Charts to visualize the Wireless Vibration and Temperature sensor data. These statistics can help us to take necessary possible steps after an early fault detection and eradicating the possibility of degradation of machines. We have seen in our previous blogs that how the wireless vibration and temperature sensors served different applications and helped us in fault detection and irregular vibrations in the machine.
In this blogs we will be serving a webpage from the gateway device and will be monitoring the sensor data using Google Charts. here we will be learning about the following:
- Wireless Vibration and Temperature Sensors
- Hardware Setup
- Gathering the data using Wireless gateway device
- Vibration analysis using these Sensors.
- How to make a web page and serve it using ESP32 Asyncwebserver.
- Load google charts in the web page.
Software Specification
Hardware Specification
Guidelines to Check Vibration in the MachinesAs mentioned in the last blog " Mechanical Vibration Analysis of Induction Motors". There are certain guidelines that are to be followed in order to segregate the fault and fault identifying vibration. For the brief rotational speed frequency is one of them. Rotation speed frequencies are characteristic of different faults.
- 0.01g or Less - Excellent condition - The machine is properly working.
- 0.35g or less - Good condition. The machine is working fine. No action required unless the machine is noisy. There can be a rotor eccentricity fault.
- 0.75g or more - Rough Condition- Need to check the motor there can be rotor eccentricity fault if the machine is making too much noise.
- 1g or more - Very Rough condition - There can be a severe fault in a motor. The fault might be due to bearing fault or bending of the bar. Check for the noise and temperature
- 1.5g or more- Danger Level- Need to repair or change the motor.
- 2.5g or More -Severe Level-Shut down the machinery immediately.
The vibration values, that we are getting from the sensors are in milis. These consists of the following values.
- RMS value- root mean square values along all three axes.The peak to peak value can be calculated as
peak to peak value = RMS value/0.707
- Min value- Minimum value along all three axes
- Max values- peak to peak value along all three axes. The RMS value can be calculated using this formula
RMS value = peak to peak value x 0.707
- Earlier when the motor was in good condition we got the values around 0.002g. But when we tried it on a faulty motor the vibration we examined was about 0.80g to 1.29g. The faulty motor was subjected to high rotor eccentricity. So, we can improve the fault tolerance of the motor using the Vibration sensors.
First of all we will be hosting a web page using ESP32. To host a web page we just need to follow these steps:
- Clone or download ESPAsyncWebServerlibrary.
- ESPAsyncWebServer library needsAsyncTCPfor its operation.
- Include the library header file.
#include "ESPAsyncWebServer.h"- Then initialize an object of Web Server class it takes port as an argument.
AsyncWebServer server(80);- Now create a HTML web page using any text editor, we are using notepad++ in our case. To know more about creating web pages go through this blog. Here in this web page we are calling google charts API feeding the sensor values to the charts. This web page is being hosted at root web page. You can find the HTML web page code here.
- Store the web pages in SPIFFS.
- Then send a server request to open the web pages at root and other URL's using server.on().
server.on("/", HTTP_GET, [](AsyncWebServerRequest *request){ request->send(SPIFFS, "/testFinal1.html", "text/html"); });- Then begin the server using server.begin()
- Publishing to channel feed channels/<channelID>/publish/<WriteAPIKey>
- Publishing to a particular field channels/<channelID>/publish/fields/<fieldNumber>/<writeAPIKey>
- Subscribe to the channel field channels/<channelID>/subscribe/ <format>/<APIKey>
- Subscribe to the private channel feed channels/<channelID>/subscribe/fields/<fieldNumber>/<format>
- Subscribe to all fields of a channel. channels/<channelID>/subscribe/fields/<fieldNumber>/<apikey>
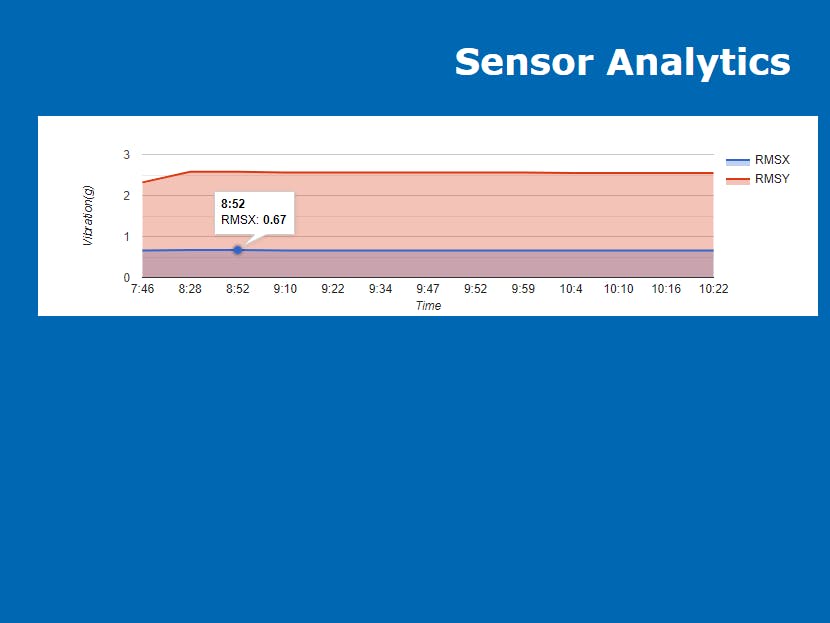
Google Charts provides very efficient way to visualize data on your website or static webpages. From simple line charts to complex hierarchical tree maps, the google chart gallery provides a large number of ready-to-use chart types.
Here we have made an User interface to analyse sensor data using Google Charts. It works as following.
- Open the local WiFi IP on the webbrowser. Webpage is served at this IP.
- Select the sensor type from the drop down list. There are different sensors available in the list.
- Then create an event for email notification or mobile notification. using IFTTT. to know more about IFTTT and webhooks and the setup go through thisblog.
- Then hit submit button. Once you hit the Submit button, Thingspeak API will be called by the function. it pulls the sensor reading from thing speak in JSON format. This JSON data will be parsed to get the real values of vibration.
- The graph will show up on left side of webpage.
We are using IFTTT applets to give real-time weather report Email notification to the user. For more on IFTTT setup you can go through this blog. So, We have implemented it through ThingSpeak. We are sending an Email Notification to the user whenever the change in Temperature occurs in a machine. It will trigger an email notification “What a beautiful day”. Every day at around 10:00 am (IST) we will be getting an email notification


Comments
Please log in or sign up to comment.