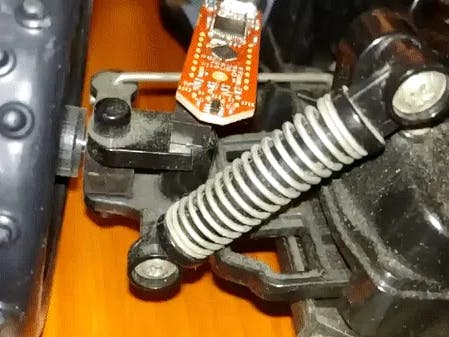
With the Infineon 3D Magnetic Sensor, we can map road conditions by using the sensor readings near the shocks of a car. For this project, I'll be using a toy RC car to prototype the idea. You can either mount the system on an actual car which will take some finessing and some car mechanic knowledge or use a RC car similar to mine that has a suspension system.
Overall ConceptThe above shows the sensor, a magnet, and the shocks all working together. The Infineon magnetic sensor will display changes in the magnetic field which will allow us to graph normal terrain/roads and abnormal ones. Ultimately, this will lead us to being able to map different road conditions based on how the suspension system of the car reacts to different roads.
ToolingIn addition to the listed hardware requirements, you'll also need power to supply the Raspberry Pi and two micro-USB cables, one for the sensor and one for the power for the Pi. We'll mostly be in Python-land and communicating via the serial port so there won't be any need for intense soldering or anything of that sort. You may need to make this more compact if you plan to deploy it on an actual car.
Software Setup1. You'll need to flash the the appropriate version of Cartesian sketch using the Arduino IDE for your board. For the 2GO kits, you can use https://github.com/Infineon/TLE493D-W2B6-3DMagnetic-Sensor even though the models aren't exactly the same. Note: Make sure the readings are displaying using the Serial Monitor in Arduino. The readings should change, if they don't that means the sensor is not being read. Examples of readings:
2.73 ; 2.73 ; 0.52
2.47 ; 2.73 ; 0.52
2.60 ; 2.86 ; 0.52
2.47 ; 2.47 ; 0.52
2. (Raspberry Pi) Install pyserial using pip
3. (Raspberry Pi) Here's the Python 3 script that will read and write the sensor readings to a file for later analysis and exploration:
import serial
ser = serial.Serial('/dev/ttyACM0')
with open('log.txt', 'w') as log_file:
 while True:
     msg = ''
     c = ser.read(1).decode('utf-8')
     while c != '\n':
         c = ser.read(1).decode('utf-8')
     c = ser.read(1).decode('utf-8')
     while c != '\n':
         msg += c
         c = ser.read(1).decode('utf-8')
     print('Writing', msg)
     log_file.write(msg + '\n')
Run the script before testing your car or else no data will be recorded!
Hardware SetupThe hardware setup is pretty straight forward, plug in the sensor using a micro-USB cable to the Pi and power the Pi using a portable battery pack. Tape/mount the components on to your chosen vehicle.
Make sure to place a magnet near the sensor else it will be hard to getting actual readings:
Demo
For demo purposes, I'm using the Pi Camera to record video alongside the recordings for the X, y, and Z readings. The camera is completely optional.
Here's the code if you want to do something similar:
import serial
import picamera
camera = picamera.PiCamera()
camera.rotation = 180
ser = serial.Serial('/dev/ttyACM0')
with open('log.txt', 'w') as log_file:
 camera.start_recording('/home/pi/video.h264')
 while True:
     msg = ''
     c = ser.read(1).decode('utf-8')
     while c != '\n':
         c = ser.read(1).decode('utf-8')
     c = ser.read(1).decode('utf-8')
     while c != '\n':
         msg += c
         c = ser.read(1).decode('utf-8')
     print('Writing', msg)
     log_file.write(msg + '\n')
 camera.close()
Here's the car with the camera mounted:
Here's the video of the terrain:
Here's the graph:
As you can see, the differentials during large bumps and when the shocks take impact, the readings are directly impacted.
Here's the code to get the graph above:
import matplotlib.pyplot as plt
over_pc = 'over_pc_log.txt'
with open(over_pc) as f:
   over_pc_log = f.read()
log_comma_data = [[ float(val) for val in line.split(' ; ')] for line in over_pc_log.split('\n') if line]
plt.plot(log_comma_data)
plt.ylabel('amplitude')
plt.xlabel('time')
plt.legend(['X', 'y', 'Z'])
plt.show()
If you mount the device on a car and collect GPS data, you'll be able to map the sensor X, y, Z readings + the geolocation data to get the worst roads in your neighborhood!


Comments
Please log in or sign up to comment.