


Hardware components | ||||||
 |
| × | 1 | |||
 |
| × | 1 | |||
 |
| × | 1 | |||
 |
| × | 1 | |||
Software apps and online services | ||||||
 |
| |||||
I always wondered what is the intensity of light falling on my succulent plant where it needs about six hours of sun per day and thought should I spend a lot of money in buying a new device. Then I found my bolt iot can tell me easily and I don’t need to spend any money to buy a special device again, so I made a simple circuit which tells the intensity of light falling on my succulent and even displays the monitored data in the form of graph.
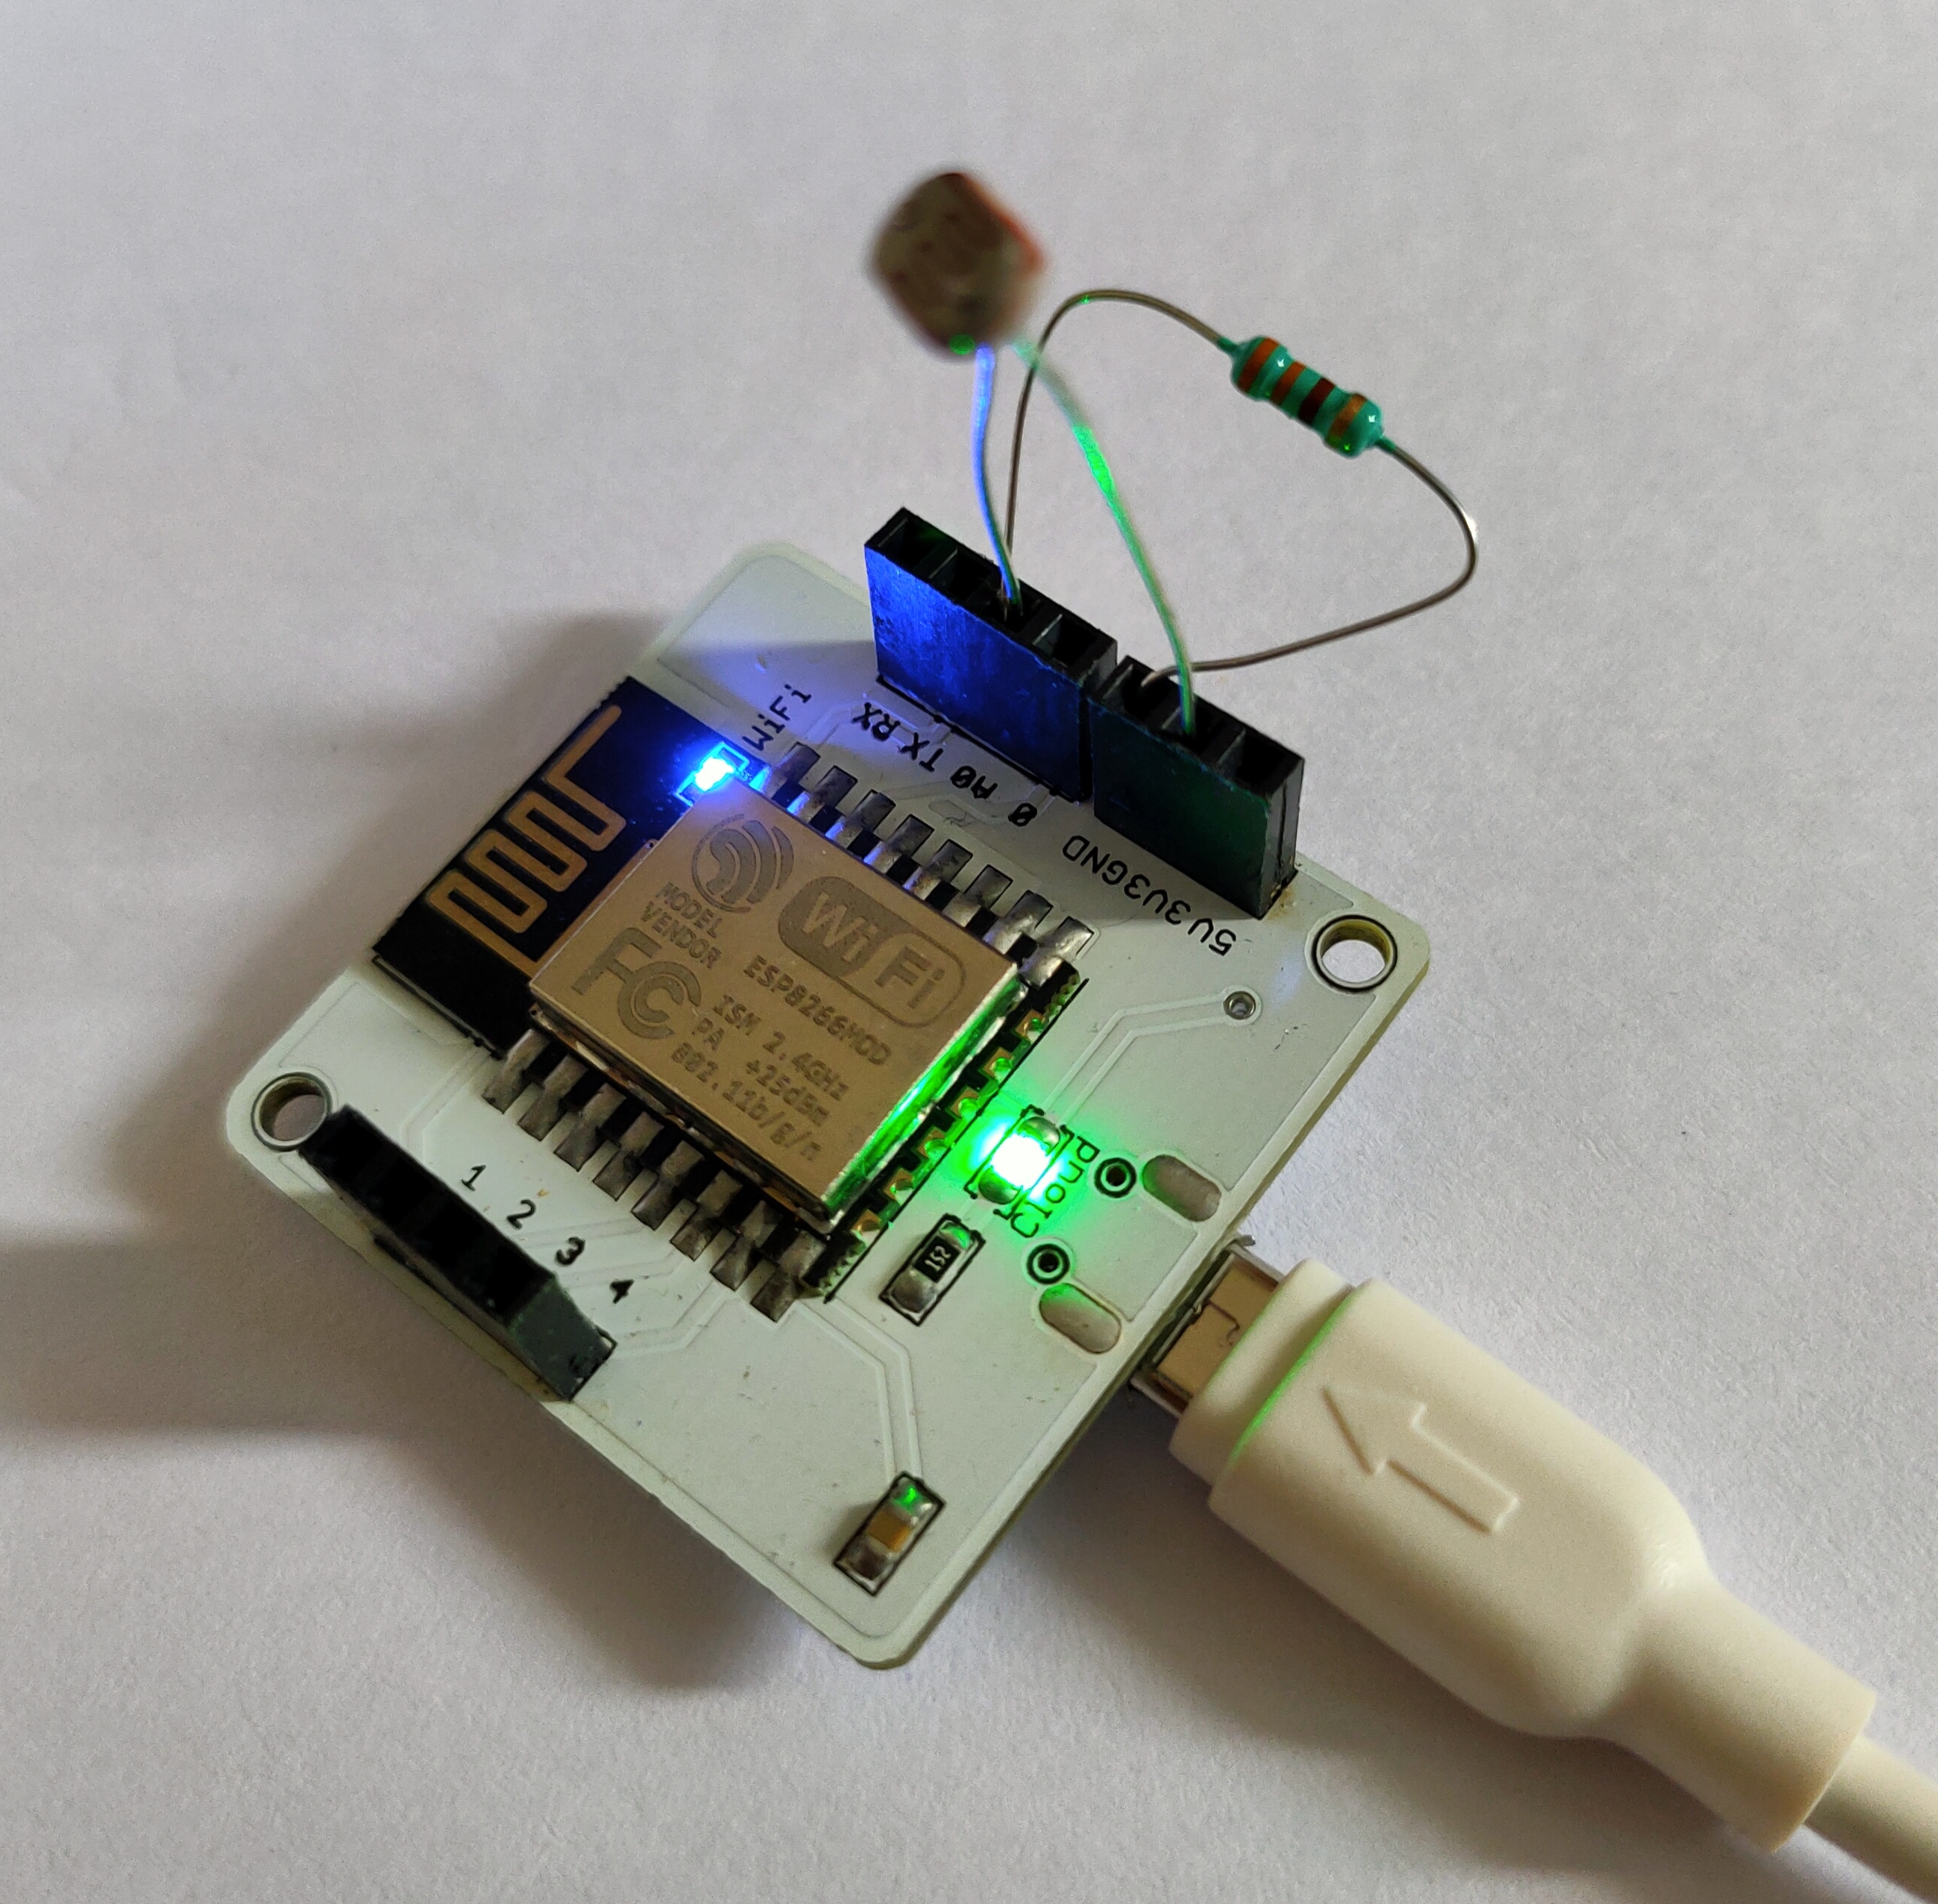
Step One: Circuit ConnectionMaking sure the bolt module is not powered on during the connection. Insert one lead of LDR (light depending resistor) into the Bolt Module’s 3V3 pin and the other into A0 pin. Now insert one leg of the 10kΩ resistor into the Gnd and the other into A0 pin (Both LDR and resistor doesn’t have a positive and negative terminals). We should make sure that no point of 3.3V touches other wires coming out, if it touches high current may flow and damage the device. The circuit looks as shown.
For creating a product on cloud, we need to login to Bolt Cloud(cloud.blotiot.com) account and we can see the blot cloud id we have linked in.
We need to create a product by clicking on product icon and then click on Build and choose a product name and image can be inserted relevant to the project. According to the devices we use, we need to choose either input or output devices to connect Bolt and from what we need to collect data either GPIO or UART. Since we know we are using input device and GPIO pins, we need to select those and click on Done.
To configure the product, we need to click on configure this product and we can see two tabs: Hardware and Code. In the hardware click on the A0 pin and give a variable name and make sure to use the same variable name in the code and then go to code and write the code as shown and select.js as we are using JavaScript and click on save and configuration message gets popped up.
We created and even configured the device and now we will link the product and click on done. Then a message pops up asking do you really want to link this product, then click on yes.
For the code and configuration to be pushed, click on deploy symbol. If you need much data in a certain period continue clicking on deploy symbol (give a time space of minimum 10sec).
Step Five: Graph VisualizationAfter some time to upload few data, now we can see the graph where predicted points, frame size, no. of polynomial coefficients are seen.
Predicted points are for the data to be predicted in future, frame size is for the no. Of points to be used to predict the trend of data ad no. of polynomial coefficients processes the input time-dependent data and outputs the coefficient of function which resembles the trend of input data.


Comments
Please log in or sign up to comment.